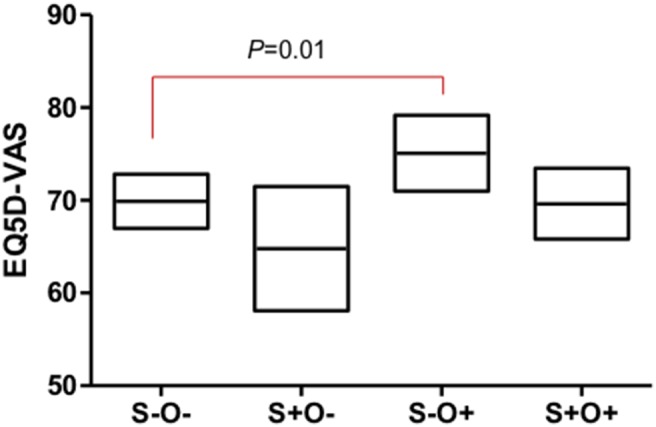
Figure 3. Comparison of quality of life according to the presence of sarcopenia and obesity (mean, 95% CI).

Legend: Values were adjusted by age, COPD stage, sarcopenia, obesity, and current smoking status. Abbreviation: absence of sarcopenia and obesity, S−O−; absence of sarcopenia and presence of obesity, S−O+; presence of sarcopenia and absence of obesity, S+O−; presence of both sarcopenia and obesity, S+O+.
