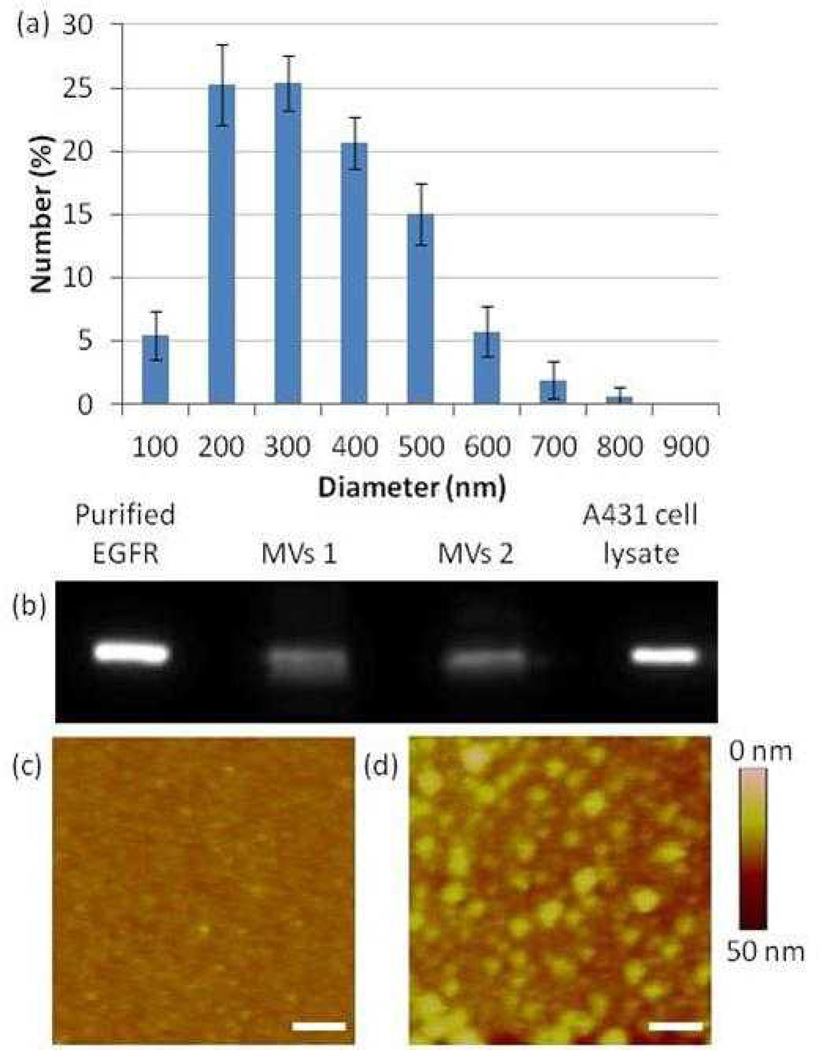
Figure 2.
(a) Size distribution of MVs derived from A431 cells (suspended in PBS) as measured by dynamic light scattering (DLS). (b) Immunoblot analysis of two separate MV samples derived from two different batches of cells of A431 cells. Lysates were immunoblotted for EGFR. (c–d) AFM images of (c) a surface decorated with anti-EGFR 111.6 and (d) a surface decorated with anti-EGFR 111.6 and subsequently incubated with MVs derived from A431 cells (scale bar: 500 nm).

