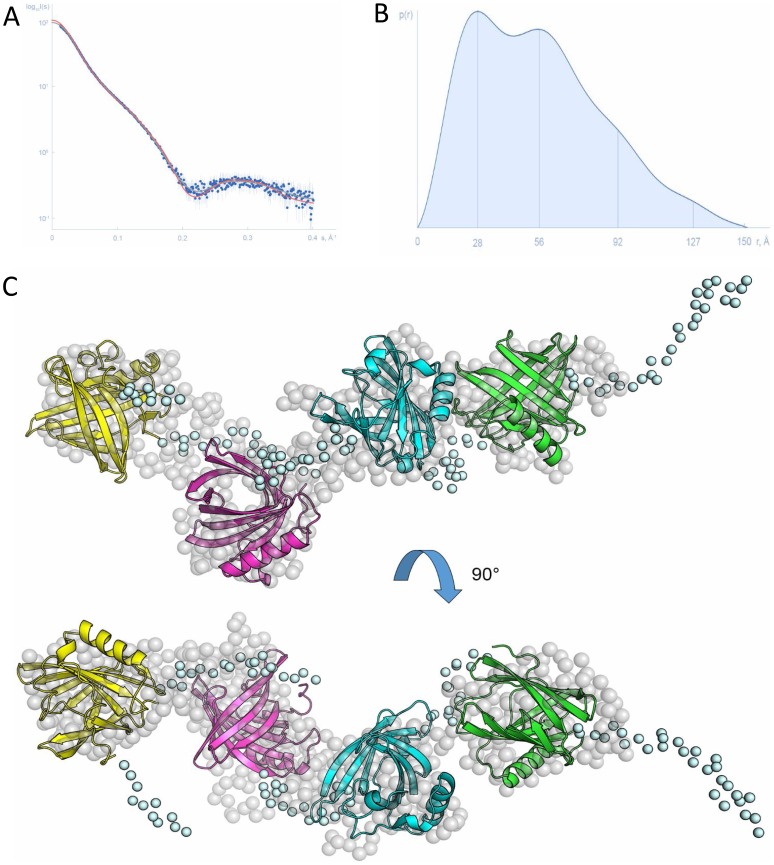
Figure 2. Can f 1-2-4-6 structure based on solution small angle X-ray scattering data.
(A) Experimental SAXS data from Can f 1-2-4-6 in solution (blue dots with error bars), computed fits from the CORAL (red line) and the GASBOR (grey line) models. (B) Respective pair distance distribution function. Maxima marked by vertical lines correspond to distances between the individual domains. (C) The rigid body model of Can f 1-2-4-6 reconstructed by the program CORAL resembles beads on a thread with each lipocalin forming a bead (cartoon representation) interspaced by extended linkers (light blue spheres). This model is in a good agreement with the ab initio GASBOR model (dummy residues represented by grey spheres).

