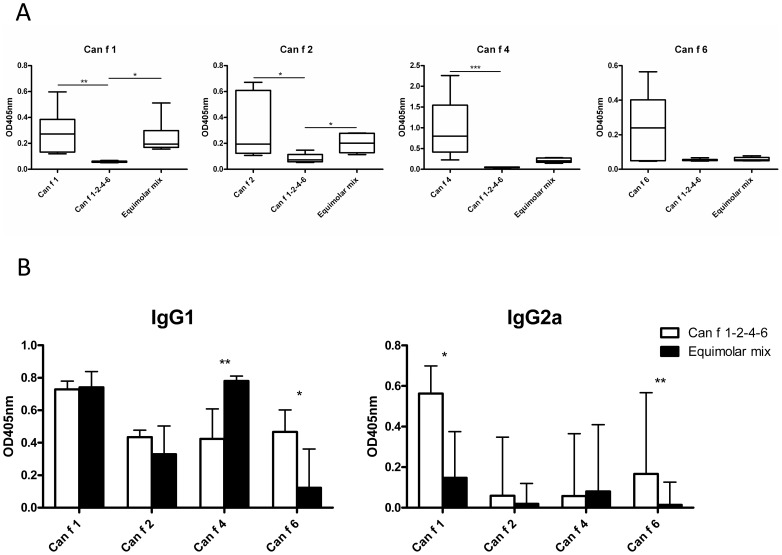
Figure 6. Antibody responses after immunization with allergens.
(A) quantification of IgE-responses in mice (n = 6) immunized with each rCan f 1, rCan f 2, rCan f 4, rCan f 6, an equimolar mix or Can f 1-2-4-6 (x-axis in graphs) to plates coated with anti-mouse IgE, mouse antiserum and biotinylated allergen (graph heading) by sandwich ELISA. (B) Comparison of IgG1 and IgG2a-antibodies to each lipocalin induced by solid phase Can f 1-2-4-6 or a mix. Immunoglobulin responses are presented as OD405 nm, y-axis. Boxes with median values and horizontal bars denote 50% of values and 1 standard deviation respectively. * p<0.05, ** p<0.01, *** p<0.001, analyzed with Kruskal-Wallis with Dunn's multiple comparison test (A, B, C) and Mann Whitney test (D).

