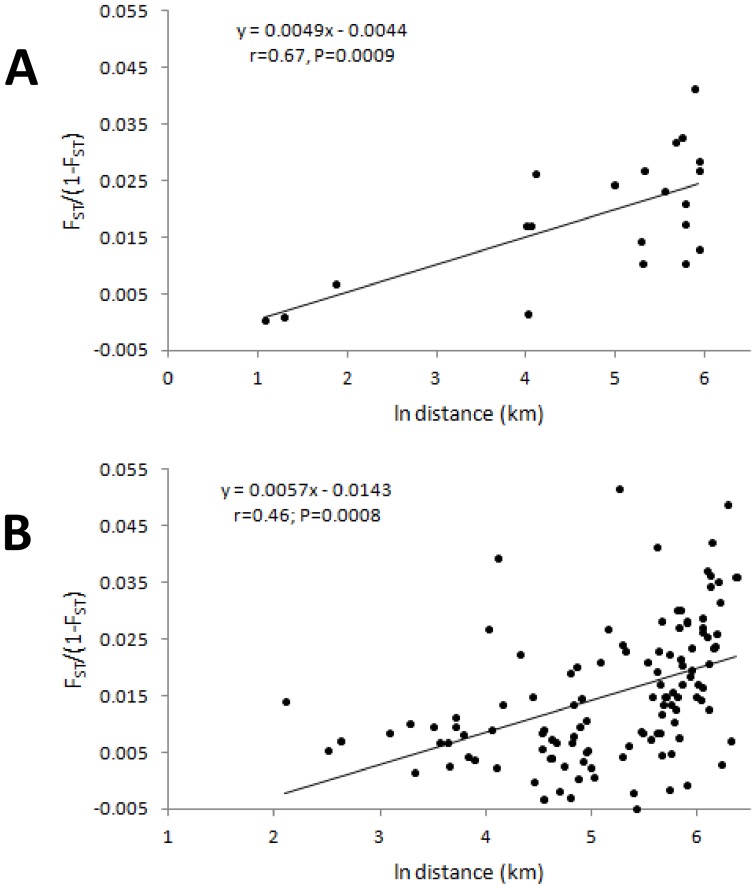
Figure 4. Isolation by distance (IBD) plots in An. gambiae s.s. (A, B) and An. arabiensis (C).
Each plot shows linearised pairwise FST against the natural logarithm of pairwise distance between sample sites. In (A) all An. gambiae sites are included, and the massive differentiation of Unguja (pairwise point in dashed circle) from all other sites obscures the IBD relationship visible in (B) once pairwise comparisons involving Unguja were excluded. In all plots insectary samples are excluded and in (C) temporal samples from the same location were pooled for the analysis. P-values are from Mantel tests.

