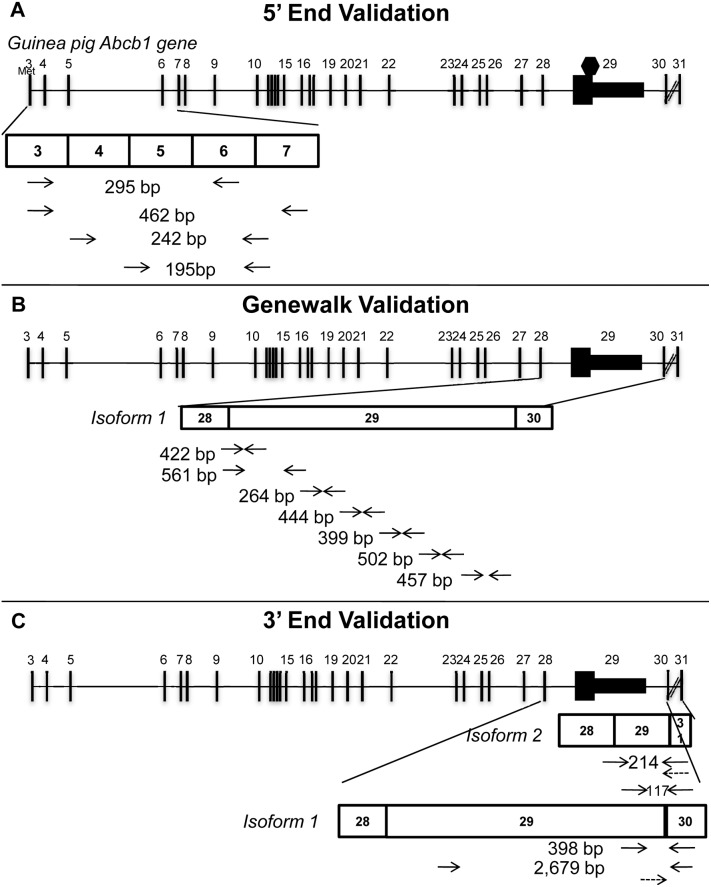
Figure 2. RT-PCR validation of guinea pig Abcb1 transcripts.
A. Diagram showing the relative emplacement of the primer pairs designed to identify and validate the 5′ (start) sequence via sequencing. B. Diagram showing the relative emplacement of the primer pairs designed to validate isoform 1 (genewalk). C. Diagram showing the relative emplacement of the primer pairs designed to validate the 3′ (end) sequence. Diagonal lines between exons 30 and 31 represent a longer region than can be represented here.

