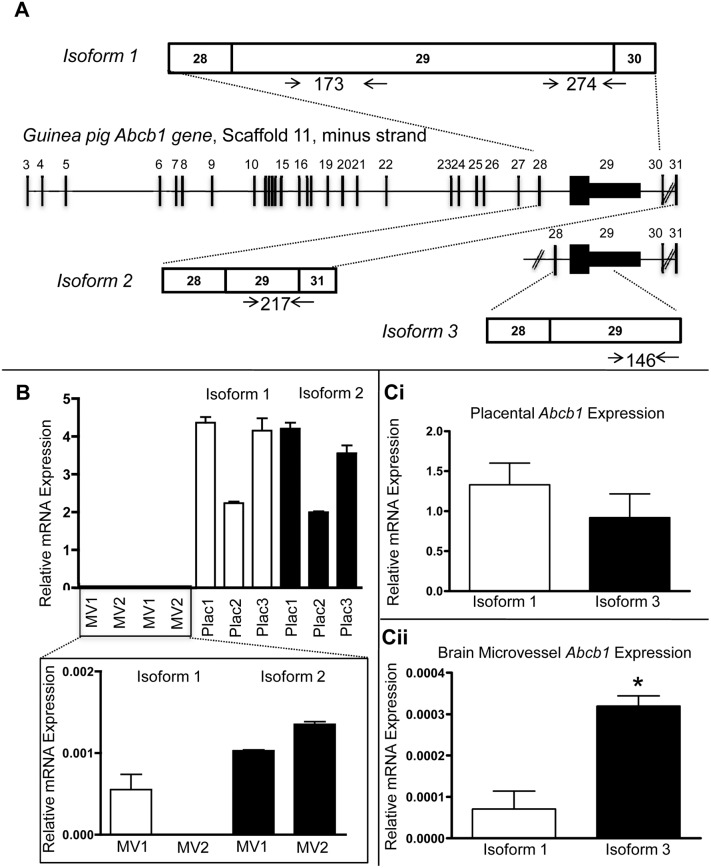
Figure 3. QPCR quantification of guinea pig Abcb1 isoforms in guinea pig placenta and brain.
A. Schematic diagram of QPCR primer pairs used to determine the relative abundance of Abcb1 isoforms 1 and 2 and isoforms 1 and 3. Diagonal lines between exons 30 and 31 represent a longer region than can be represented here. B. Bar graph of relative abundance of isoforms 1 and 2 in individual placenta and brain MV samples following QPCR with primer pairs shown in A. Differences in brain magnified in inset. C. Bar graph of average relative abundance of isoforms 1 and 3 in placental samples (Ci) and brain MV samples (Cii) following QPCR with primer pairs shown in A. All bars represent mean ± SEM. *P<0.05 as determined by Student’s t-test.

