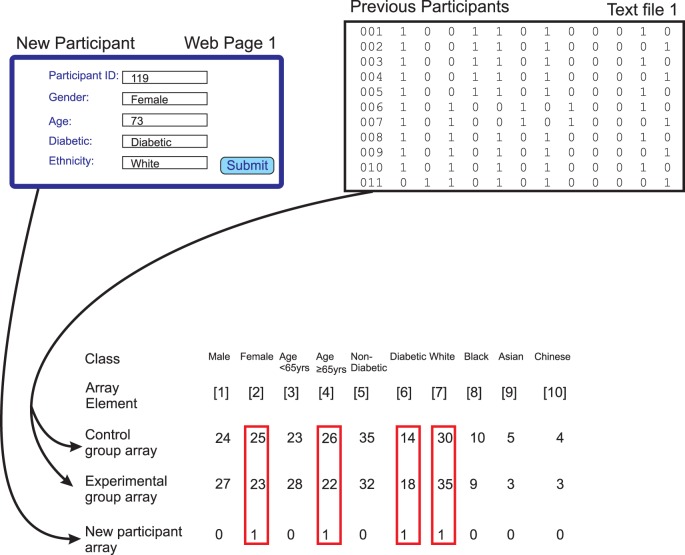
Figure 4. Use of arrays in the allocation process.
Information about the new participant is contained in an array of the type illustrated in Figure 3. Information about participants who have previously been allocated is first extracted from a text file. This information is then aggregated into two arrays that have a similar structure to that used for the new participant. One of these arrays aggregates information about participants who have been allocated to the control arm of the study and the other array aggregates information about participants who have been allocated to the experimental arm of the study. The elements from these arrays that correspond to the true values for the new participant (boxed in red) are then extracted for each of the control and experimental arrays. Comparison of the values of these elements in the control and experimental group arrays is used to determine the preferred allocation for the new participant through minimization of the difference between the two groups. In this case the sum of the values for the control group is 95 (25+26+14+30) and the sum of the values for the experimental group is 98 (23+22+18+35) so the new participant will be allocated to the control group.

