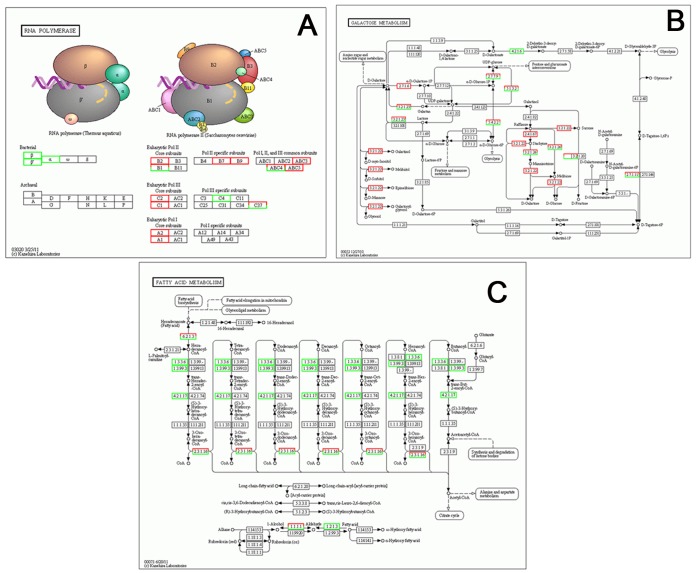
Figure 6. Pathways of ramie differentially regulated in phloem and xylem.
A. Graphic representation of the global changes in RNA polymerase pathway. B. Graphic representation of the global changes in galactose metabolism pathway. C. Graphic representation of the global changes fatty acid metabolism pathway. Red and green boxes indicate the up-regulated and down-regulated genes when phloem compared to xylem tissues.

