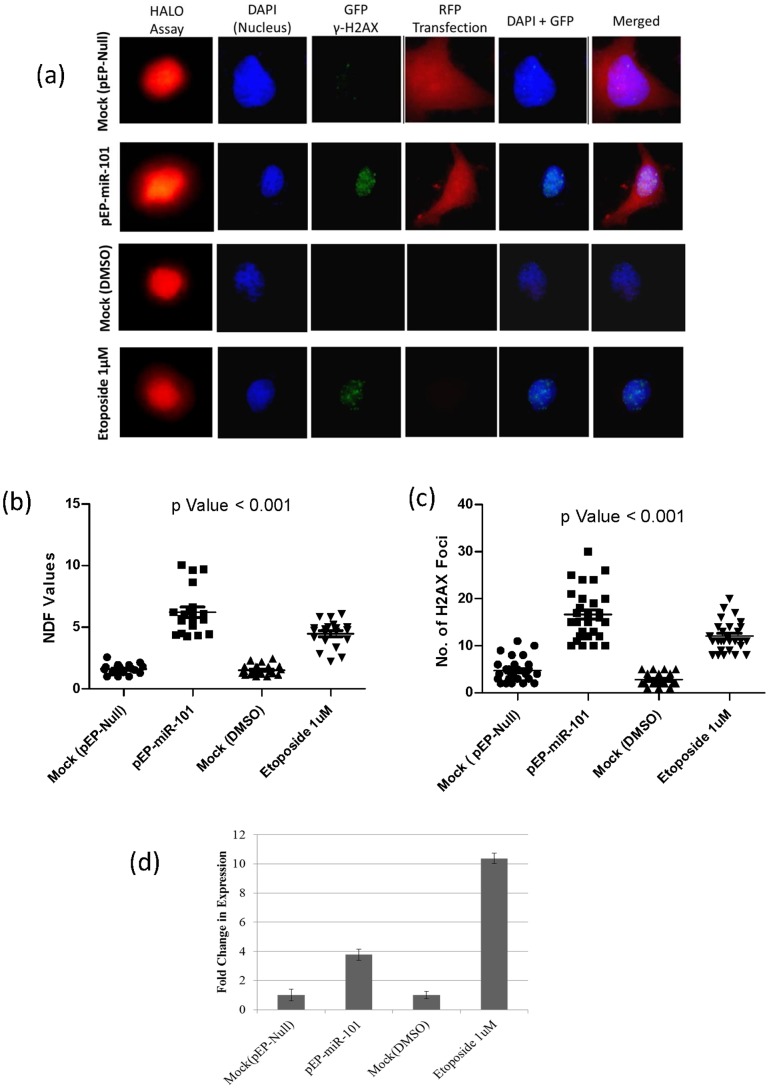
Figure 1. Visualization, quantification of DNA damage, and fold change in expression of miR-101 in MCF7 cells.
(a) Fluorescence microscopy where six columns represent - Halo Assay used for calculating NDF values, DAPI staining for nucleus, γH2AX foci with GFP tagged secondary antibodies, RFP-tagged pEP-Vector, Merged-DAPI+GFP-tagged γH2AX and Merged-DAPI+ GFP-tagged γH2AX+ RFP-tagged pEP-Vector; (b) NDF values representing the extent of diffusion of damaged DNA in cells (Halo assay) [27]; (c) number of γH2AX foci; (d) fold change in expression of miR-101, in Controls: mock-pEP-Null-transfected, mock-DMSO treated, and Experimental conditions: pEP-miR-101 transfection and Etoposide 1 µM treatment.

