
Figure 1.
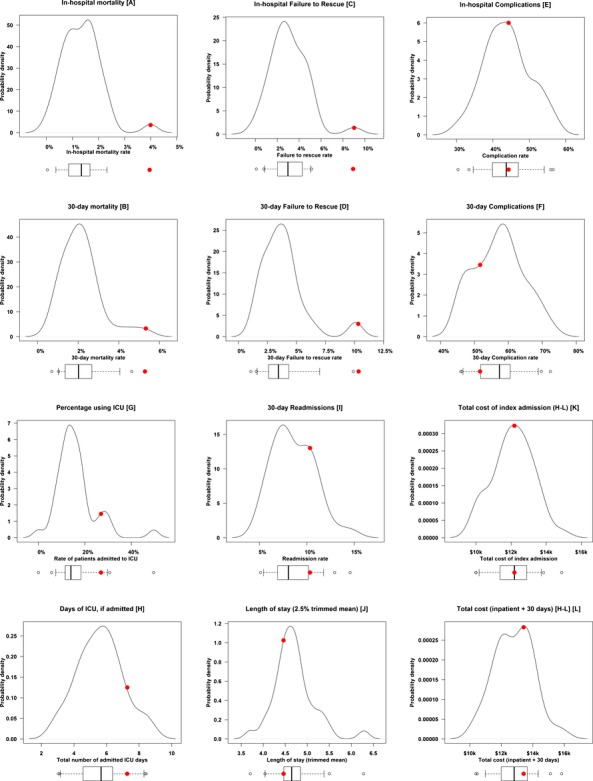
Hospital Outcomes. We display the outcomes for 43 hospitals, each hospital having 300 template-matched patients. For each outcome we provide density plots with an associated box plot providing 5th, 25th, 50th, 75th, and 95th percentile markers, as well as a depiction of outliers. We also denote individual Hospital A (examined in Table 2) as a large solid red dot on the plots. Displayed are (A) in-hospital mortality; (B) 30-day mortality; (C) in-hospital failure-to-rescue rate; (D) 30-day failure-to-rescue rate; (E) in-hospital complication rate; (F) 30-day complication rate; (G) percentage of patients using the ICU; (H) ICU LOS in patients using the ICU; (I) 30-day readmission rate; (J) Length of stay (2.5 percent trimmed mean); (K) total costs of the index admission (Hodges–Lehmann estimates); (L) total cost of the index admission, plus total costs 30 days after discharge from the index admission (Hodges–Lehmann estimates)