Figure 3.
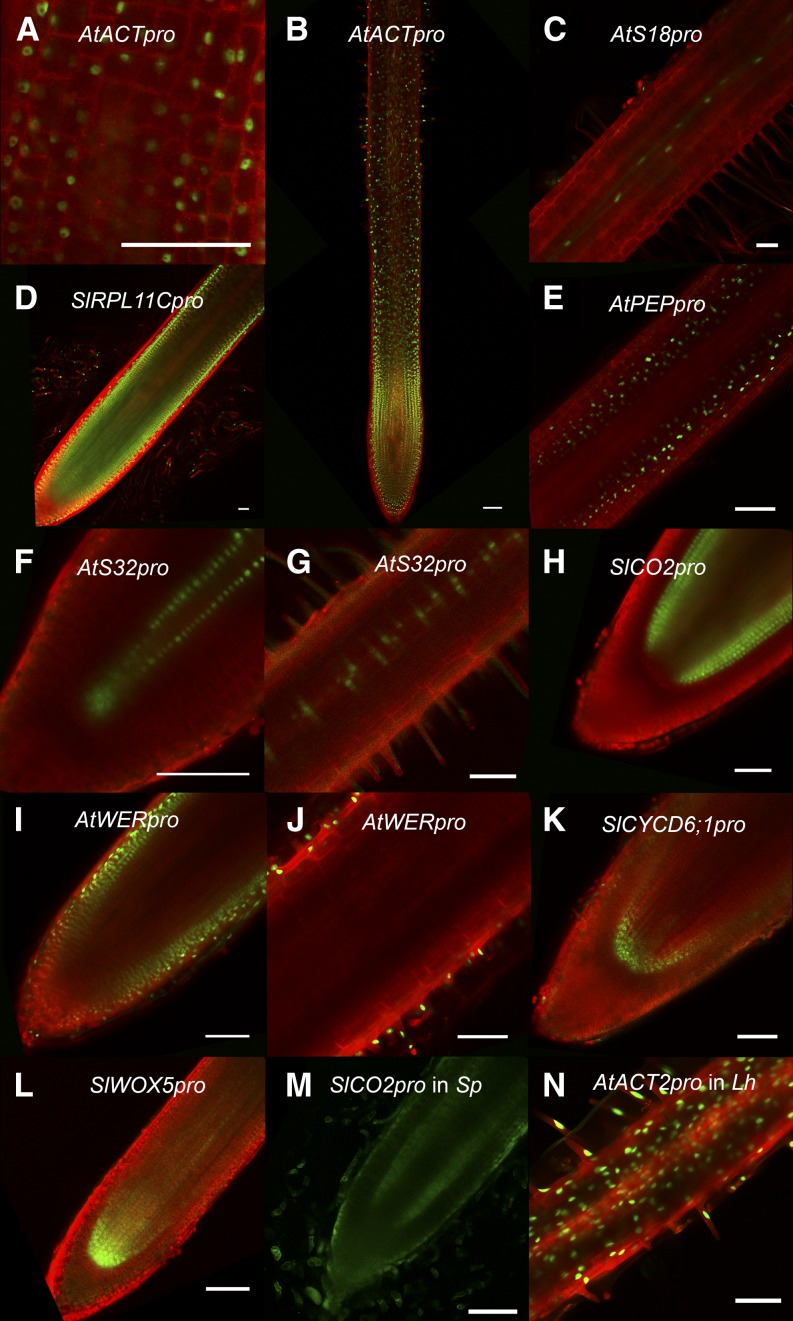
A cell type- and tissue-specific promoter toolbox. GFP expression patterns driven by a variety of promoters were tested in the hairy root transformation system by cloning them upstream of an nlsGFP-GUS fusion in a vector containing a ubiquitously expressing plasma membrane marker: G10-90pro-TagRFP-LTI6b (A–D, G–I, and K) or 35Spro-TagRFP-LTI6b (E and F). A and B, AtACT2pro drives near constitutive expression (under 63× and 10× magnification, respectively). The nlsGFP (green) shows nuclear localization, and TagRFP (red) shows plasma membrane localization. C, AtS18pro drives expression in the maturing xylem (10×). This image contains an overlay of GFP fluorescence from two different focal planes to show both phloem strands. D, SlRPL11Cpro expression is most pronounced in the meristematic zone (10×). E, AtPEPpro drives expression in the cortex throughout the root, including the elongation zone (20×). F and G, AtS32pro drives expression in the phloem, starting in the meristematic zone (F; 40×) all the way to mature root (G; 20x). H, SlCO2pro drives expression in cortex layers only in the meristematic zone (20×). I and J, AtWERpro drives expression in the lateral root cap (I; 20×) and all epidermal cells throughout the root (I and J; 20×). K, SlCYCD6pro drives expression in the QC and vascular initials (20×). L, SlWOX5pro drives expression in the QC and vascular cells in the proximal meristem (20×). M, SlCO2pro drives expression of AtRPL18CDS-GFP in the meristematic cortex of S. pennellii (20×). This image was taken without linear unmixing, so green represents both GFP and autofluorescence. N, AtACT2pro also drives near constitutive expression in L. hyssopifolium hairy roots (20×). Bars = 100 μm.

