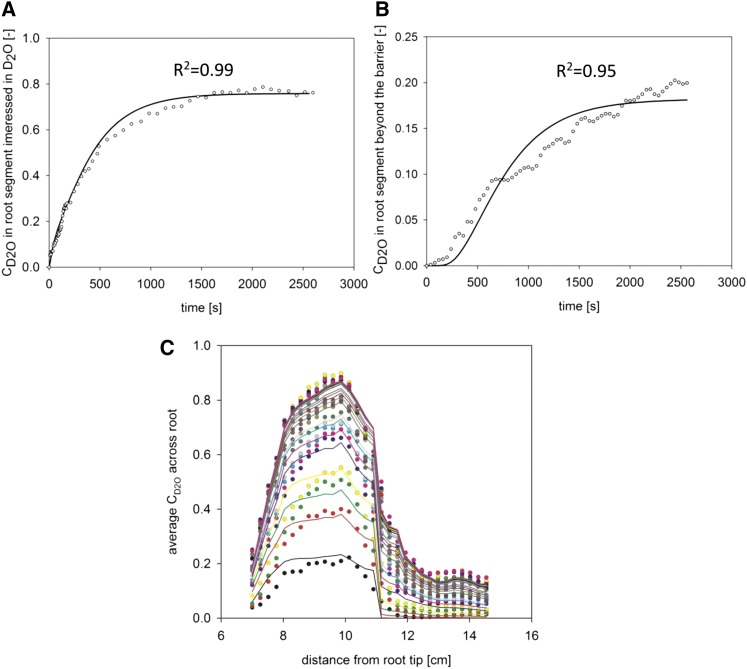
Figure 6.
Measured concentration of D2O (dots) and the best fit of the simplified model (solid lines) for roots partly immersed in D2O. The simulated concentrations refer to the root in Figure 5. Root length and location of D2O injection are illustrated in Figure 7A. A, Average D2O concentration in the root segment immersed in D2O with the best fit of the model. B, Average D2O concentration in the root segment beyond the capillary barrier with the best fit of the model. C, Average D2O concentration across the root as a function of distance to the root tip at different time steps after D2O injection. Each line refers to a different time step after D2O injection.

