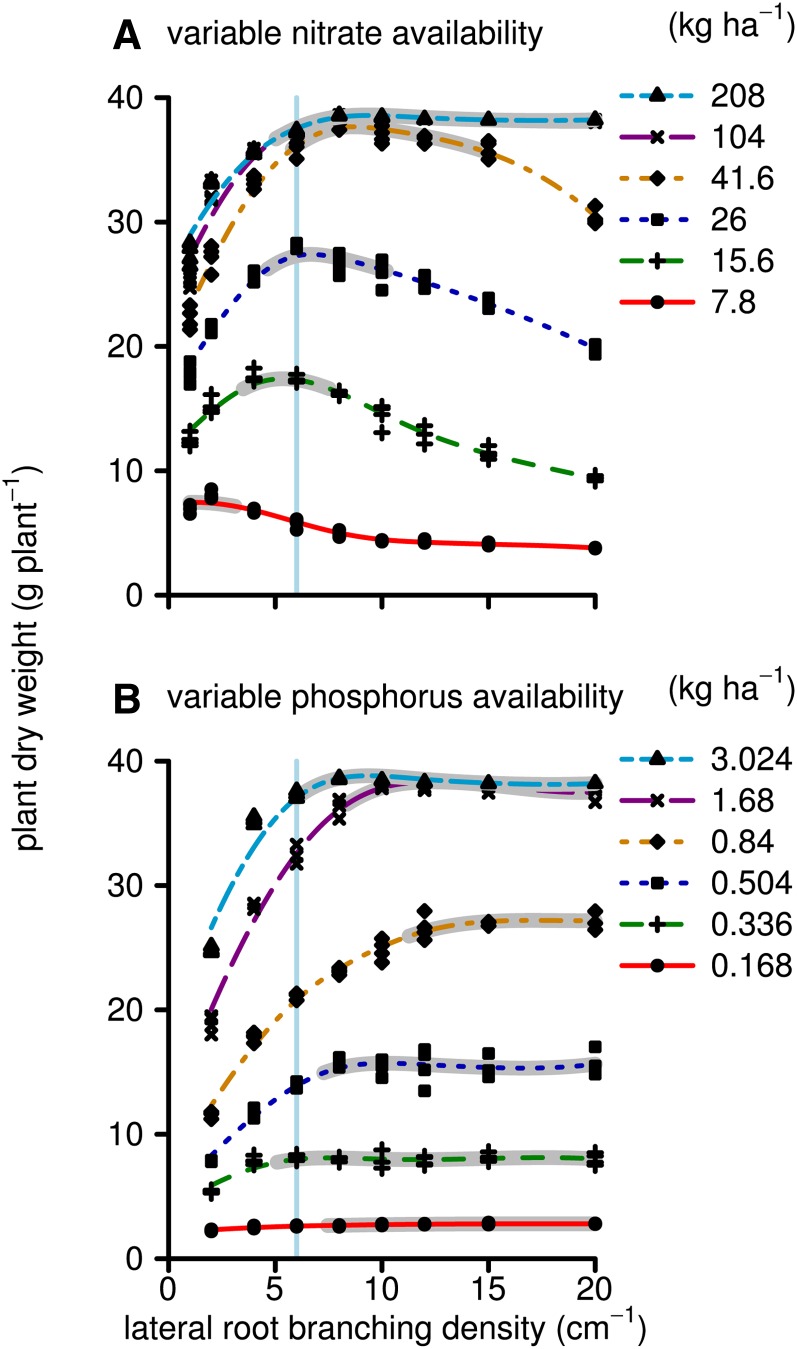
Figure 2.
Simulated plant dry weight (g) at 40 d after germination. Each dot represents one simulation in which the maize root system had a given branching frequency (x axis) and a given nutrient regime (see key). A, Simulations for which nitrogen was the growth-limiting nutrient. B, Simulations for which phosphorus was the growth-limiting nutrient. Lines are smoothed splines drawn through the results of a set of simulations that had the same initial nutrient conditions. Nutrient conditions are presented as the initial nutrient availability (in kg ha−1) at the start of the simulation. For phosphorus, this is phosphate (PO4) in solution (not including the buffering). For each line, the region that is within 95% of the maximum is highlighted in gray. The vertical light blue line indicates the median branching frequency observed in a diverse panel of maize lines (Table I). For nitrate, the 104 kg ha−1 scenario is partly hidden behind the 208 kg ha−1 scenario. [See online article for color version of this figure.]

