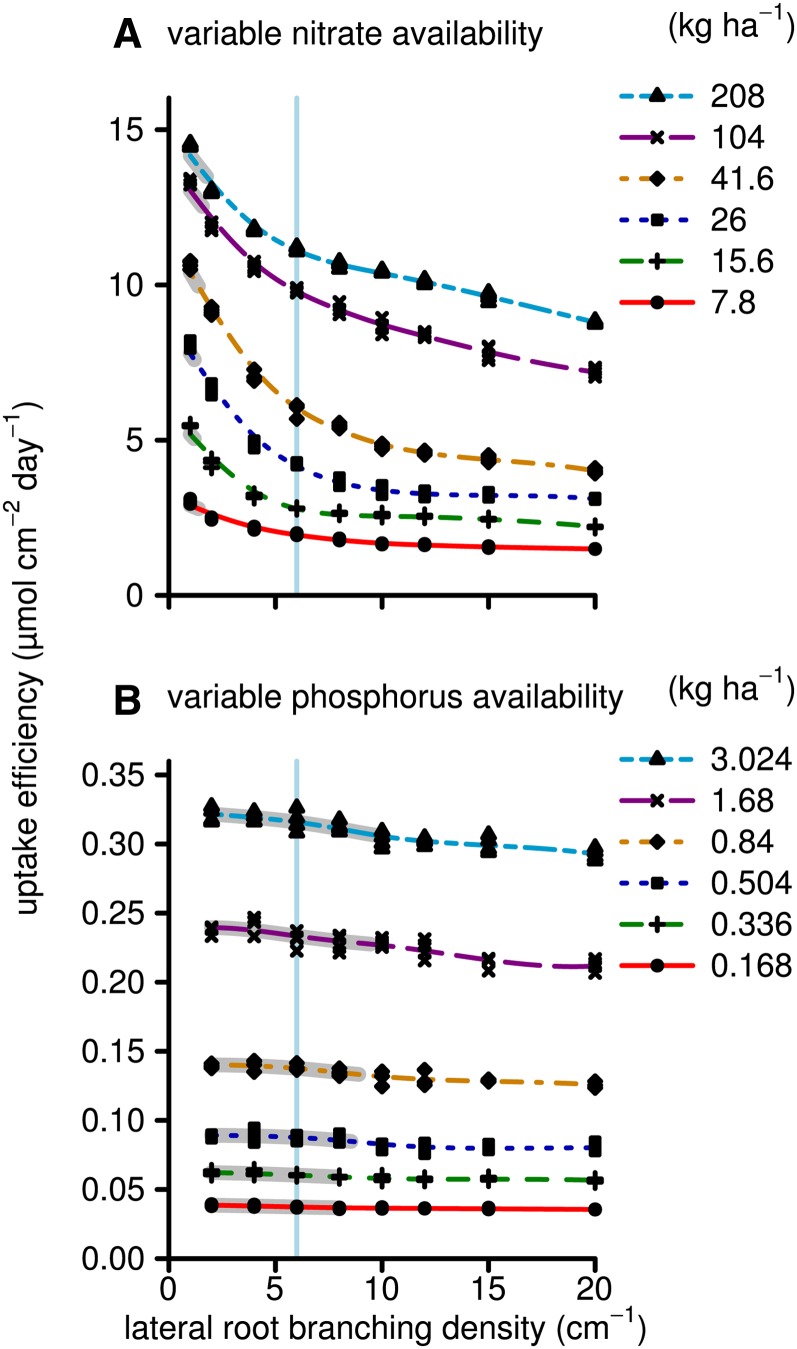
Figure 7.
As in Figure 2, but showing the nutrient uptake per surface duration (μmol cm−2 d−1) instead of the plant dry weight. The y axis shows the total nutrient uptake (Fig. 3) divided by the root surface area duration, which is the integral of the root surface area over time and thereby an important component for explaining total nutrient uptake. Root competition as well as less favorable coincidences of roots and nutrients in space and time may decrease the uptake per unit area. [See online article for color version of this figure.]

