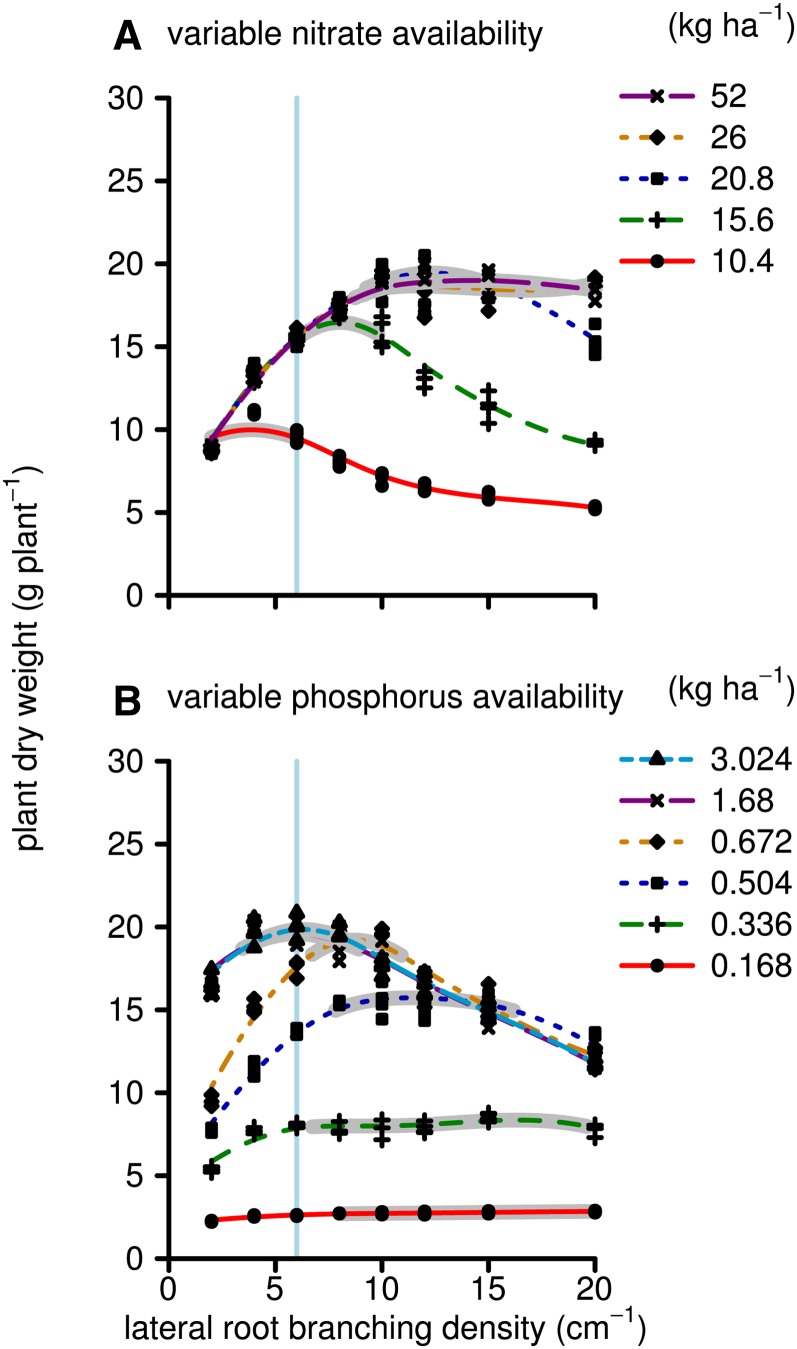
Figure 8.
As in Figure 2, but here we did not assume that when varying the availability of one nutrient the availability of the other nutrient was high. That is, in A, the phosphorus availability was 0.588 kg ha−1, and in B, the nitrate availability was 18.2 kg ha−1. Thereby, the biomass response shows how well the LRBD phenotype (x axis) performed in a soil where the relative availability of both nitrate and phosphorus might limit growth at some time during the life cycle of the plant. [See online article for color version of this figure.]

