Figure 5.
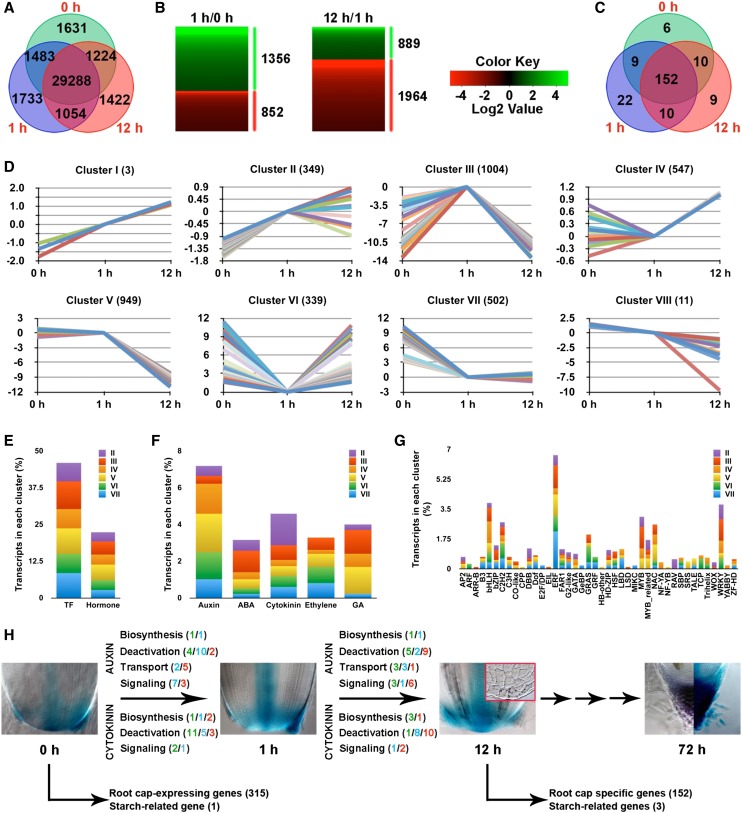
Transcriptome dynamics during early phases of root cap regeneration and identification of root cap-specific genes. A, Venn diagram illustrating the number of unique (nonoverlapping circles) and common (overlapping circles) transcripts identified in the regenerating root tip at 0, 1, and 12 h after deCAP. B, Heat map showing differentially induced (in green) and repressed (in red) transcripts identified between consecutive time points (1 h/0 h and 12 h/1 h). Transcripts with an absolute threshold value of a log2 ratio ≥ 1 and a false discovery rate ≤ 0.001 were identified as differentially expressed. Details of the transcripts are presented in Supplemental Table S1. C, Venn diagram depicting the number of root cap genes whose transcripts were not detected at 0, 1, and 12 h after deCAP. Details of the transcripts are presented in Supplemental Table S4. D, Clusters (I–VIII) of 3,704 transcripts with common expression changes during early phases of root cap regeneration, identified by k-means clustering of differentially expressed transcripts shown in B and listed in Supplemental Table S3. E to G, Percentage of transcripts encoding transcription factors (TFs) and genes involved in the biosynthesis, deactivation, and signaling of five major classes of plant hormones in each cluster. E, All classes. F and G, Individual classes. Details of the transcripts are presented in Supplemental Table S3. H, Summary for the presented data. Transcripts associated with metabolism and signaling of auxin and cytokinin exhibited dynamic transcriptional changes in response to deCAP. The numbers are color coded to indicate the following: green, induced; red, repressed; and blue, no change. Transcripts of 315 root cap genes were identified as common transcripts for 0, 1, and 12 h (Supplemental Table S4), suggesting that they are also expressed in the root meristem. Transcripts of 152 root cap genes, including three of four starch-related genes identified previously in the rice root cap, had no expression within 12 h (Supplemental Table S4), indicating that they are root cap specific in the rice root tip (Supplemental Fig. S5). DR5::GUS expression at 0 h (Fig. 4A), 1 h (Fig. 4B), 12 h, and 72 h (Fig. 4E) and Lugol staining at 12 h (inset) and 72 h after deCAP are shown.

