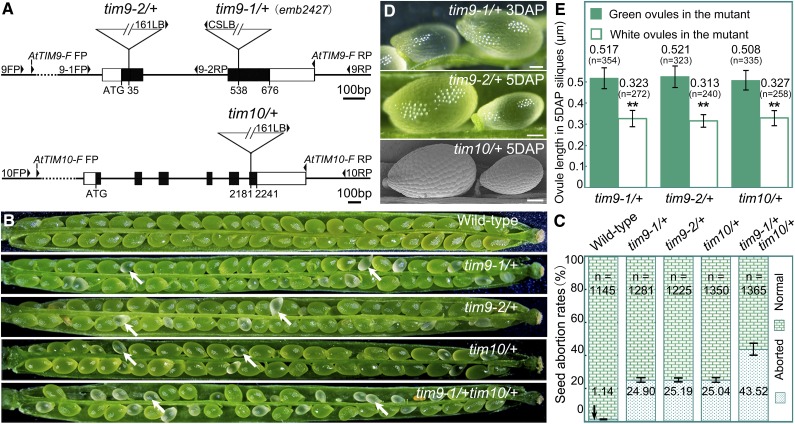
Figure 1.
Characterization of the AtTIM9 and AtTIM10 mutations. A, Schematic diagrams of the AtTIM9 and AtTIM10 gene structures with the positions of the T-DNA insertions of three mutants. Exons are shown as black boxes, 5′ and 3′ regions as white boxes, and introns and untranslated regions as lines. FP, Forward primer; RP, reverse primer. B, Silique phenotypes of the wild type and mutants. The white arrows show the aborted white ovules. C, Seed abortion rates in the mutants compared with the wild type. The total number (n) of counted seeds is listed on the top of the histogram, and the seed abortion rate values are shown on the bottom. D, Ovule phenotypes in wild-type and mutant siliques. Bars = 1 mm. E, White ovule length compared with green ovules from heterozygous tim mutant parents. The total number (n) of counted ovules and the average ovule length values are shown above the histogram. [See online article for color version of this figure.]

