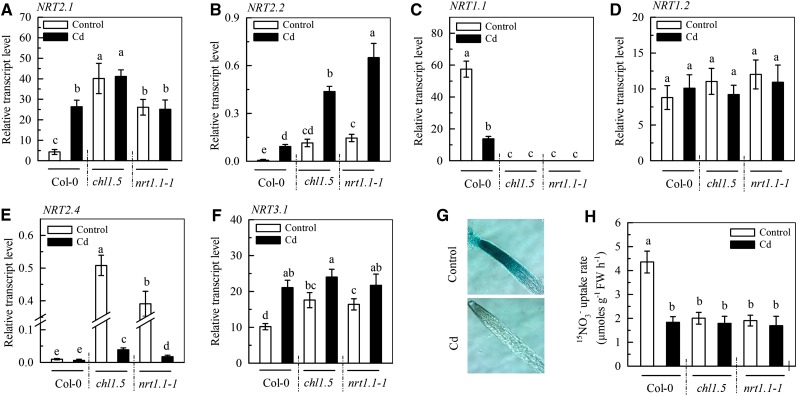
Figure 2.
Role of NRT1.1 in the cadmium-induced inhibition of NO3− uptake. A to F, The treatments of the Col-0 plants, chl1.5 and nrt.1-1 mutants, and pNRT1.1::NRT1.1-GUS transgenic plants were the same as those in Figure 1, A to F. For real-time quantitative PCR analysis of expression of NRT2.1, NRT2.2, NRT1.1, NRT1.2, NRT2.4, and NRT3.1, transcript levels were normalized to those of UBIQUITIN10 mRNA (100%). G, GUS staining of the root of pNRT1.1::NRT1.1-GUS transgenic plants. H, NO3− uptake rate in Col-0, chl1.5, and nrt1.1-1 plants measured using 2.25 mm 15NO3– for 5 min. The bars in A to F and H represent the sd (n = 4–8 biological replicates). Different lowercase letters above bars indicate significant differences at P < 0.05 (lsd test). FW, Fresh weight.

