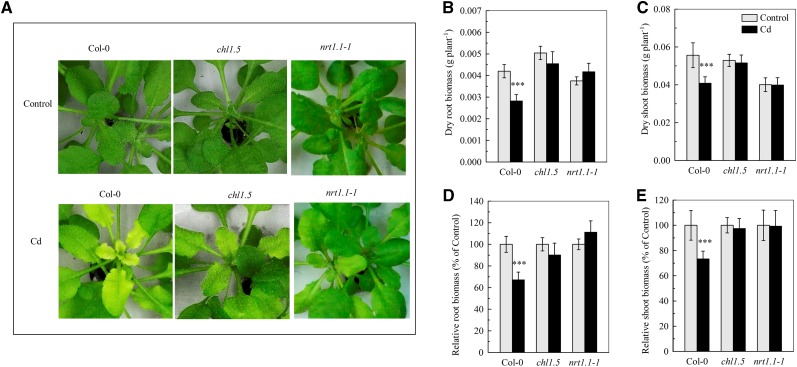
Figure 3.
Sensitivity of Col-0, chl1.5, and nrt1.1-1 plants to cadmium. The plants were treated in the same way as in Figure 1. A, Chlorosis of the newly formed leaves. B, Dry root biomass. C, Dry shoot biomass. D, Relative root biomass. E, Relative shoot biomass. The relative biomass was calculated as the mean dry weight expressed as a percentage of the control dry weight in the same plant line. Bars represent the sd (n = 8 biological replicates). Asterisks indicate a significant difference from the control value (***P < 0.001; two-tailed Student’s t test).

