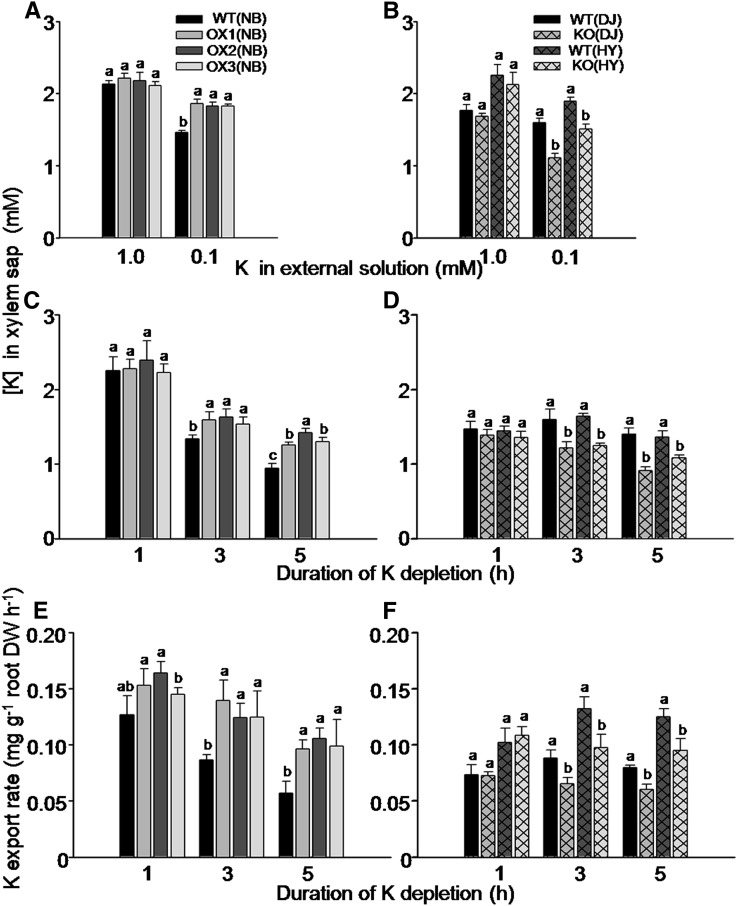
Figure 6.
Effect of OsHAK5 expression level on K concentration and transport rate in the xylem sap of rice supplied with different concentrations of K in the culture solution. A, C, and E, OX lines and their wild types. B, D, and F, KO lines and their wild types. A to D, K concentration in the xylem sap. A and B, The seedlings were grown in IRRI solution containing 1 mm K for 8 weeks, then transferred to medium without K for 3 d and further transferred to either 1 mm K or 0.1 mm K solution for collecting xylem sap and K analysis after 1 h of partial shoot excision. C and D, The seedlings were grown in IRRI solution containing 1 mm K for 8 weeks, and then the excision procedure was repeated, but without prestarvation for K. The root with the stump was transferred to 0 mm K solution for up to 5 h. The xylem sap was collected for 1 h in two hourly intervals (i.e. during the first hour, the second to third hour, and the fourth to fifth hour, counting from removal of the K supply). E and F, K export rate in the xylem sap. After the end of xylem sap collection, the entire root system of each plant was excised and its dry weight was determined. The shoot excision, xylem collection, and calculation of K export rate are described in “Materials and Methods.” The abbreviated names of wild types and transgenic lines are as in Figure 4. Error bars indicate se (n = 5 plants). Significant differences from the wild type in each group (NB, DJ, or HY) are indicated by different letters (P < 0.05, one-way ANOVA).

