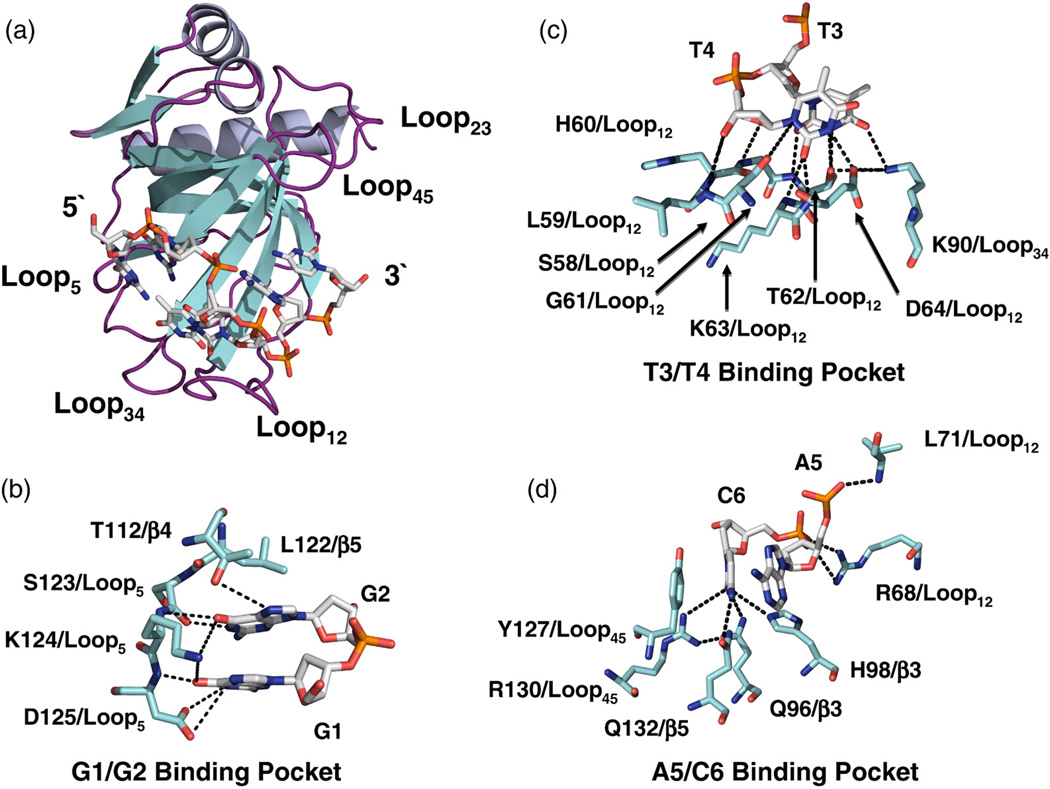
Fig. 1.
(a) Ribbon (Pot1pN) and stick (ssDNA) representation of the high-resolution crystal structure of the Pot1pN/ssDNA complex11 highlighting the compact conformation of the bound oligonucleotide, d(GGTTAC). Pot1pN is shown in a ribbon representation with the α-helical elements shown in purple, the β-strand elements shown in yellow, and connecting loops shown in magenta. Each connecting loop found within the OB fold is labeled according to the β-strands that it connects (e.g., the loop connecting β−1 and −2 is designated as Loop12). d(GGTTAC) is shown in stick representation and colored according to standard atomic colors. (b–d) Stick representations detailing the molecular interactions that occur between individual residues in Pot1pN (blue sticks) and d(GGTTAC) (white sticks) in the three binding pockets—G1/G2, T3/T4, and A5/C6. Hydrogen-bonding interactions formed between Pot1pN and d(GGTTAC) are designated by black dashed lines. All figures were made using PyMOL version 1.0.23

