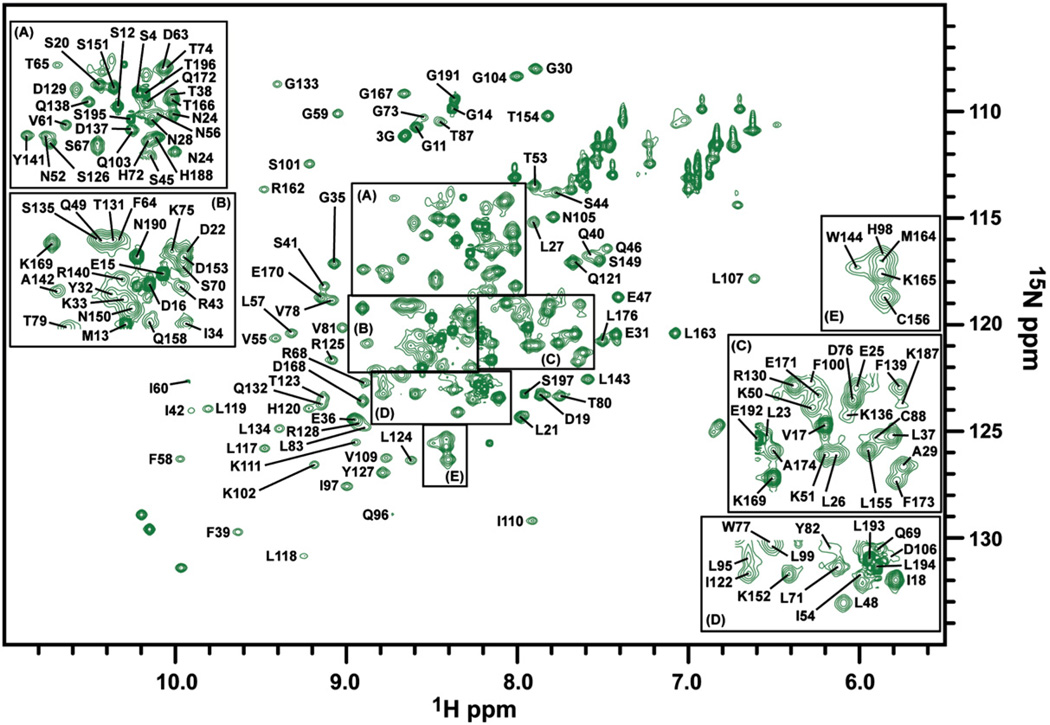
Fig. 2.
15N HSQC spectrum of the Pot1pNF collected on a Varian 500-MHz spectrophotometer equipped with a room temperature probe at 30 °C. Peaks representing the individual amino acids present in Pot1pN are labeled with their corresponding residue assignments. For clarity, selected regions of the 15N HSQC spectrum are enlarged [panels (a–e)] to display selected assignments.

