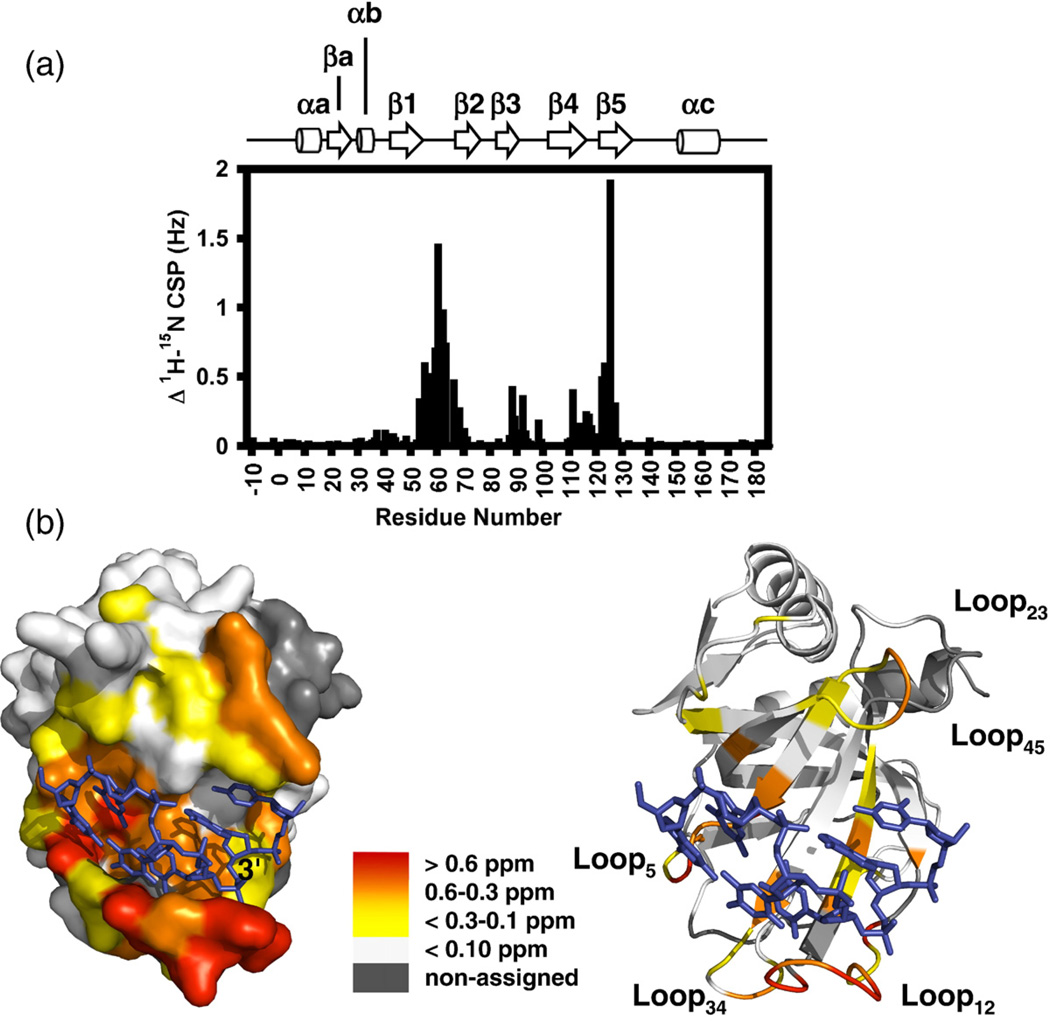
Fig. 3.
15N–1H CSP analyses of Pot1pNF and Pot1pNB. (a) Differences in the composite 15N–1H chemical shifts for Pot1pNF and Pot1pNB plotted as a function of residue number. The secondary structure elements of the high-resolution X-ray crystallographic structure of Pot1pNB11 are shown above for reference. (b) Surface (left) and ribbon (right) representation of the high-resolution X-ray crystallographic structure of Pot1pNB11 with the individual residues colored according to their respective chemical shift differences: >0.6 ppm in red; 0.6–0.3 ppm, orange; <.3–0.1 ppm, yellow; and <0.1 ppm, white. Nonassigned residues in either Pot1pNF or Pot1pNB are shown in gray. All figures were made using PyMOL version 1.0.23

