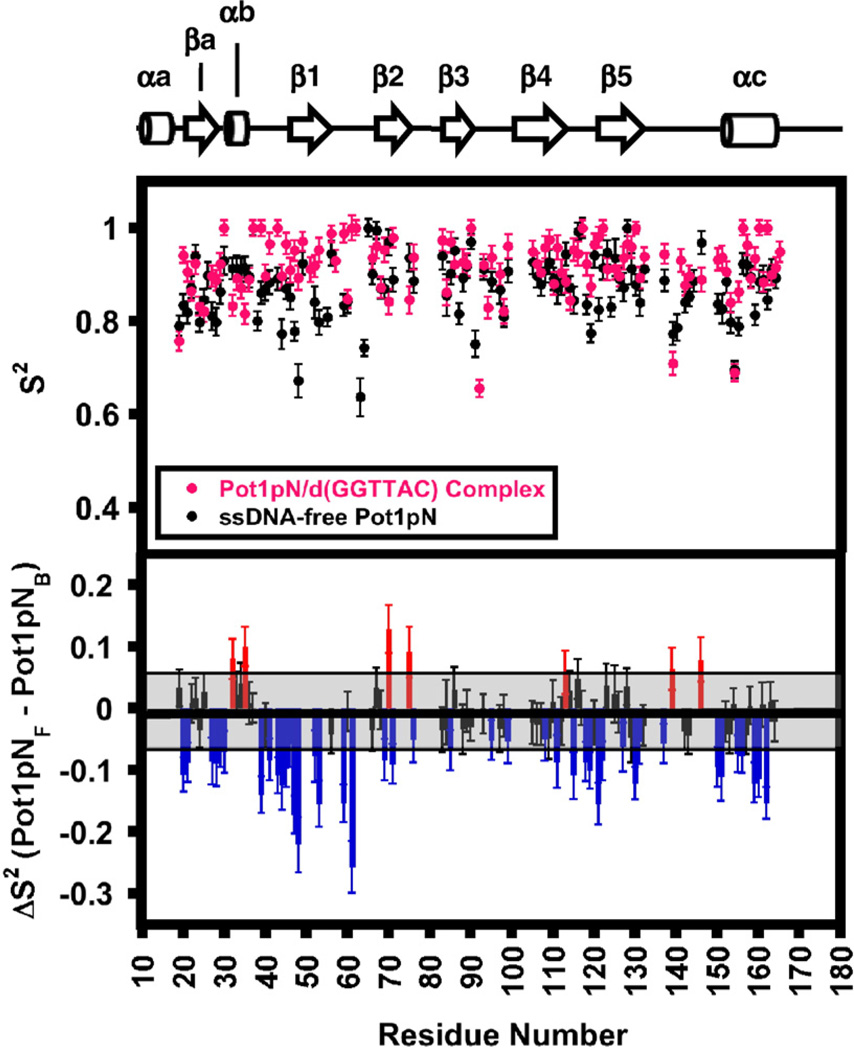
Fig. 5.
ModelFree S2 values for the backbone amides present in Pot1pNF (black) and Pot1pNB (magenta) derived from HetNOE, R1, and R2 experiments collected at 500 and 600 MHz at 30 °C. The upper panel contains S2 values calculated for Pot1pNF (black) and Pot1pNB (magenta) plotted as a function of residue number. Associated errors in S2 values were calculated by the fitting of 300 Monte Carlo simulated data sets with ModelFree.36 The lower panel is a bar graph showing the per-residue differences between the Pot1pNF and Pot1pNBS2 values plotted as a function of residue number. Residues falling within the average error of (shaded black box) the calculated S2 values were found to have no difference in the overall structure (black bars). Residues outside the average error were found to be less structured either in the absence (blue bars) or in the presence (red bars) of d(GGTTAC).

