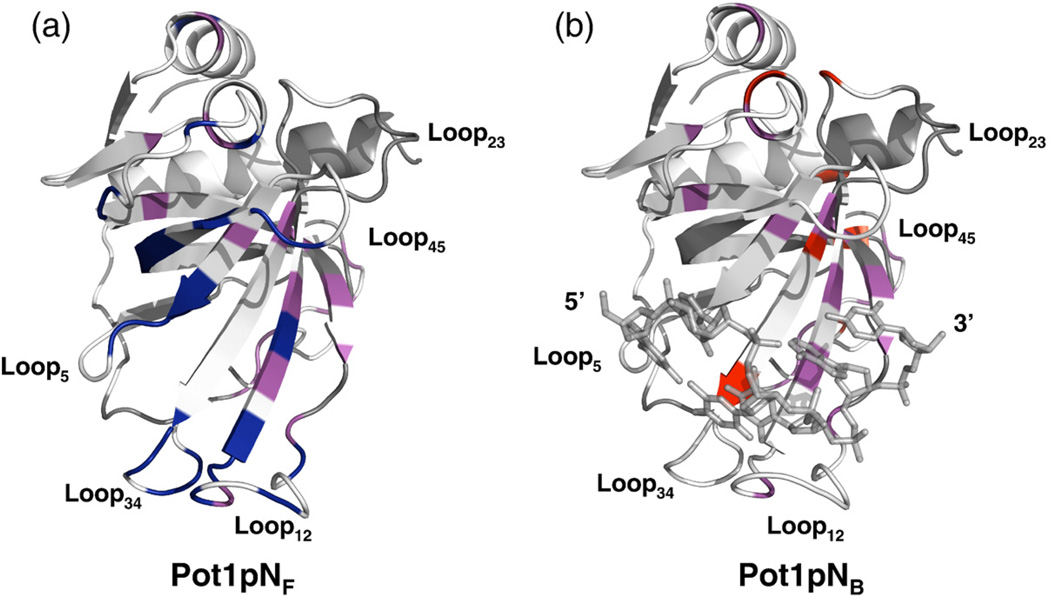
Fig. 6.
Ribbon (Pot1pN) and stick (ssDNA) representation of the high-resolution crystal structure of the Pot1pN–ssDNA complex11 highlighting the residues that undergo dynamic motion on the microsecond–millisecond timescale in both Pot1pNF and Pot1pNB. (a) Residues experiencing microsecond–millisecond dynamic motion in Pot1pNF only are shown in navy, those in both Pot1pNF and Pot1pNB are shown in magenta, and those that showed no motion are shown in white. (b) Residues experiencing microsecond–millisecond dynamic motion in Pot1pNB only are shown in navy, those in both Pot1pNF and Pot1pNB are shown in magenta, and those that showed no motion are shown in white. In both cases, residues shown in gray represent unassigned residues in both Pot1pNF and Pot1pNB. All figures were made using PyMOL version 1.0.23

