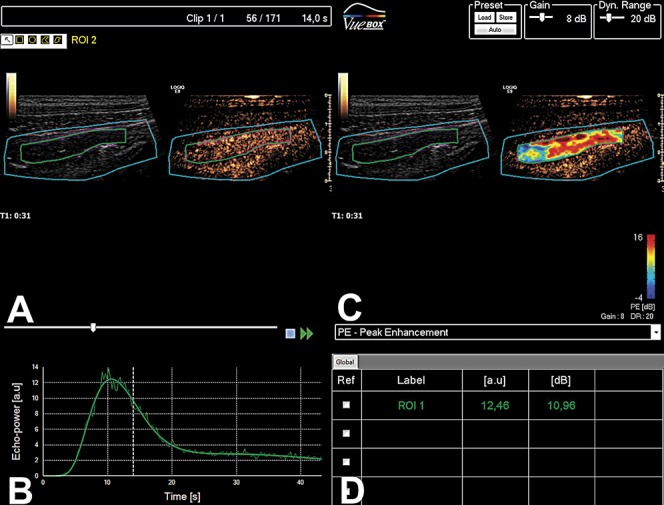
FIGURE 2.

CEUS of the intestine in a patient with CD. A, the ultrasound image is presented as B-mode to the left and in a contrast mode to the right. B, Enhancement with Sonovue linearized to arbitrary units together with the modeled time-intensity curve. C, Ultrasound-image with B-mode to the left and a parametric color map covering the contrast image to the right. D, Table displays the quantitative data obtained from the analysis.
