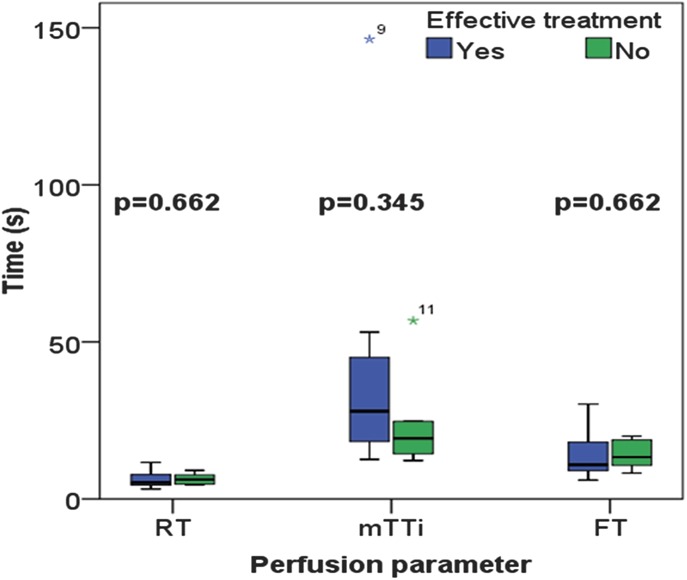
FIGURE 5.

Box-plot representation of the results from the time-related variables such as rise time, fall time, and mean transit time in patients with active CD 1 month after initiating medical treatment. Group 1 (blue boxes) responded well to the treatment, whereas group 2 (green boxes) had treatment failure. There were no significant differences between the groups (Mann–Whitney U test).
