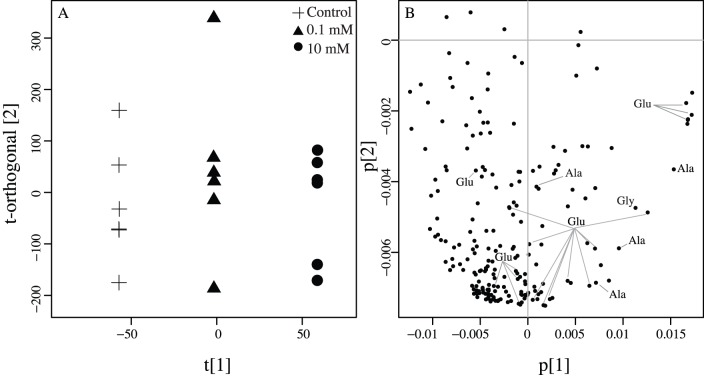
Figure 2. Separation in metabolite profiles after experimental addition of alanine, glucose, and glycolic acid.
(A) OPLS-DA model comparing the control, 0.1 mM, and 10 mM metabolite spiking treatments. Separation within and between treatments is represented by the t-orthogonal- and t-axis, respectively. Model statistics are reported (Table 2). (B) Corresponding loading plot showing 1H-NMR bin coefficients. Bins arising from each spiking compound are indicated. Ala = alanine, Glu = glucose, Gly = glycolic acid.

