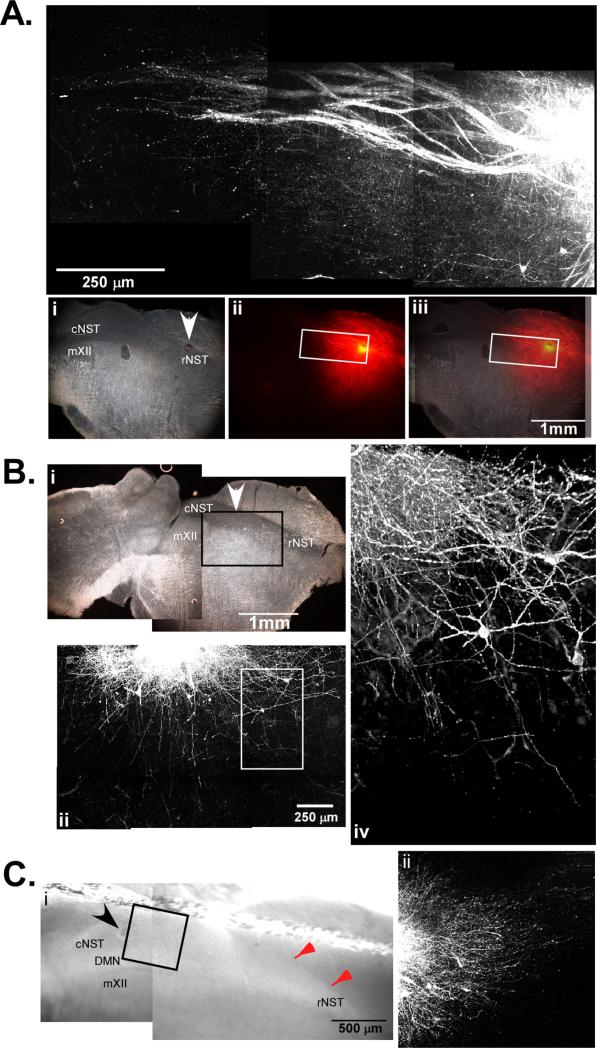
Fig. 3.
(A) Photomicrograph if the rNST following an injection of DiI into rNST in a 450 μm oblique section. The area around the DiI injection site was imaged with a multiphoton confocal microscope to a depth of approximately 300 μm. Axonal projections course through the NST in the caudal direction as well as into the underlying reticular formation. The visible fibers in this case spanned a distance of approximately 1.2 mm from the center of the injection site. Dark-field photomicrograph (i) of the same tissue sectioned at 40 μm showing the injection site (arrow) and nuclei contained in the slice. The middle column (ii) is fluorescent photomicrograph of the same tissue section. Fibers were seen projecting away from the injection site into the cNST and the subjacent RF. The white box indicates the area imaged with the multiphoton microscope. (B) Photomicrograph taken of a case where DiI was injected into intermediate NST (arrow) in a 450 μm tissue block, and re-sectioned on a freezing microtome at 40 μm (i). The area around the DiI injection site was imaged with a multiphoton confocal microscope prior to re-sectioning to a depth of approximately 300 μm (ii). Axonal projections are seen infiltrating the underlying reticular formation and projecting in the direction of the rNST. On the right (iv) is a 3D projection of the area in the white box at a higher magnification showing axons running into the reticular formation. (C) Photomicrograph of the section just after DiI injection into the cNST and prior to fixation, a “harp” string in seen running above the dorsal border of the NST (red arrows). On the right is a photomicrograph of DiI labeled fibers coursing rostral within the NST. (For interpretation of the references to color in this figure legend, the reader is referred to the web version of the article.)

