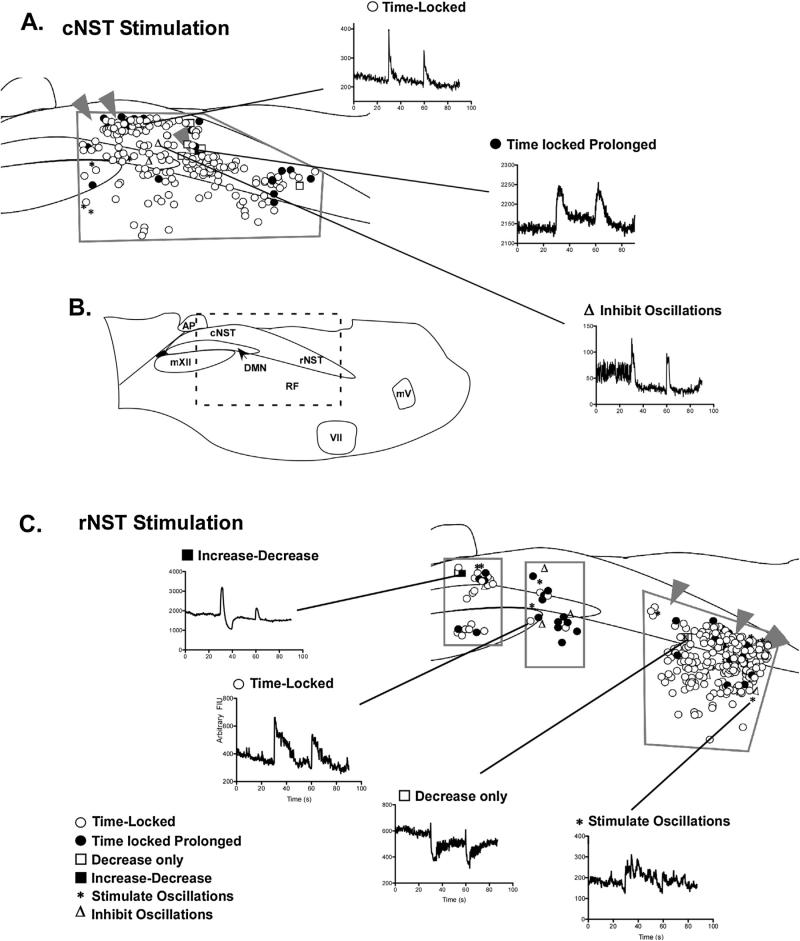
Fig. 4.
Diagrammatical representation of location and response types of cells categorized in calcium imaging experiments. All characterizations and mapping were performed with SR95531 and strychnine in the media. (A) Diagram of responses observed when stimulating the cNST (arrowheads are the location of the stimulating electrode). The regions imaged for mapping experiments are outlined in gray. (B) Diagram of the slice indicating the location and putative boundaries of nuclei housed within the slice. The box denotes the area depicted in (A) and (C). (C) The lower panel diagrams response types observed with stimulation of the rNST (arrowheads). The area imaged for mapping experiments is outlined in gray. Representatives for each response type (Table 1) are shown between both (A) and (C).

