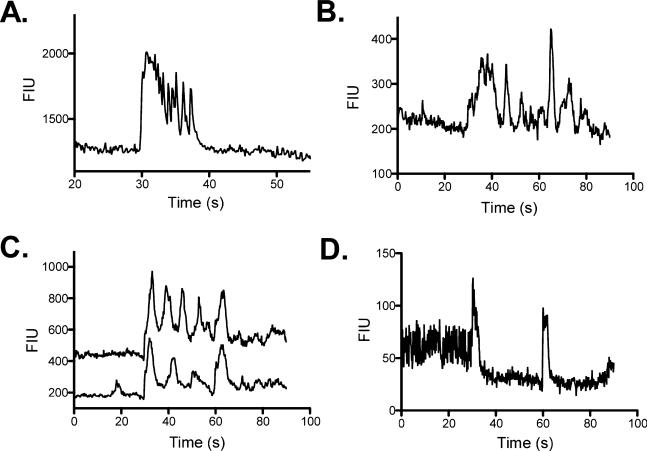
Fig. 6.
Representative examples of cells that responded with oscillatory changes in fluorescent intensity following NST stimulation. (A) Response type categorized by an initial time-locked increase in fluorescent intensity followed by rapid oscillations as the signal returned to baseline. (B) Following the initial response, this cell type demonstrates repeated oscillations with amplitudes similar to the initial stimulus response. (C) This cell type began oscillating after the first stimulus; however, oscillatory activity was inhibited following the second stimulation. (D) This cell type presented with oscillatory activity prior to stimulation that was inhibited by the stimulation.

