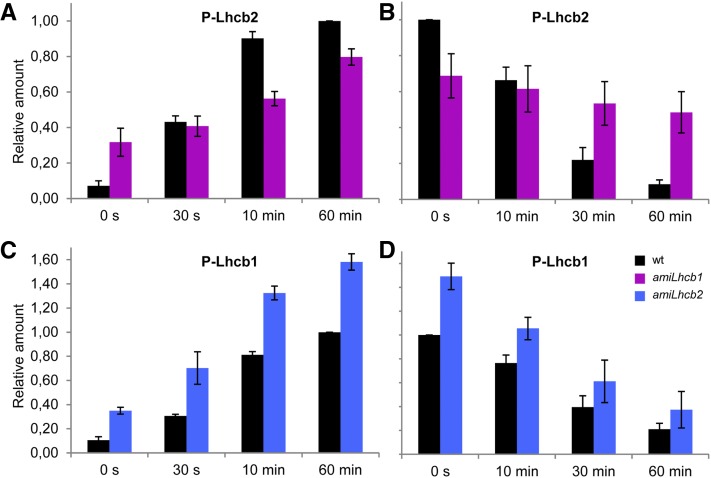
Figure 6.
LHCII Phosphorylation and Dephosphorylation Kinetics in amiLhcb1 and amiLhcb2 Arabidopsis Lines.
(A) and (B) Kinetics of wild-type and amiLhcb1 Lhcb2 phosphorylation after shifting from state 1 to state 2 light (A) and dephosphorylation after shifting from state 2 to state 1 light (B). Arabidopsis leaves were collected and snap frozen at different time points during the course of respective light treatment. One microgram of total chlorophyll was loaded and the phosphorylation was quantified and normalized to the maximum phosphorylation level of the wild type obtained after 60 min of red light treatment.
(C) and (D) Lhcb1 phosphorylation (C) and dephosphorylation (D) in the wild type and amiLhcb2. Error bars represent se obtained from three biological replicates.
[See online article for color version of this figure.]

