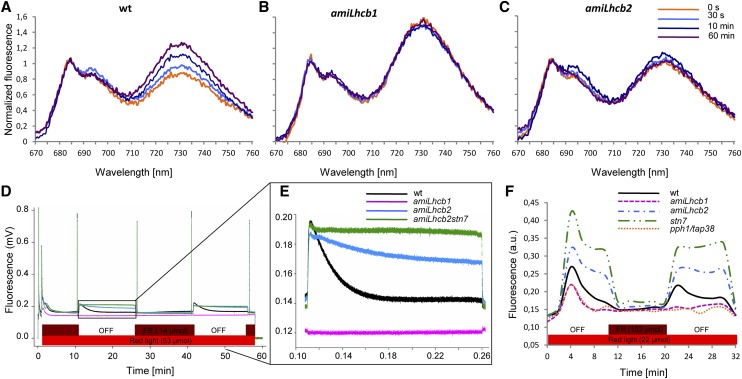
Figure 7.
Absence of State Transitions in amiLhcb1 and amiLhcb2.
(A) to (C) 77K chlorophyll fluorescence spectra before (0 s, orange) and 30 s (light blue), 10 min (dark blue), and 60 min (purple) after shift from state 1 to state 2 light for wild-type (A), amiLhcb1 (B), and amiLhcb2 (C) Arabidopsis lines.
(D) Pulse amplitude-modulated fluorescence traces after shifts from state 1 to state 2 light and back for wild-type (black), amiLhcb1 (magenta), amiLhcb2 (blue), and amiLhcb2stn7 (green) Arabidopsis lines. The bars at the bottom indicate illumination with red (shown in red) and far-red (dark red) light.
(E) Enlargement of a section of (D).
(F) PQ oxidation state (measured as F/Fm) of wild-type (black), amiLhcb1 (magenta), amiLhcb2 (blue), stn7 (green), and pph1/tap38 (orange) Arabidopsis lines after a shift from state 1 to state 2 light and back. Fluorescence is shown in arbitrary units.

