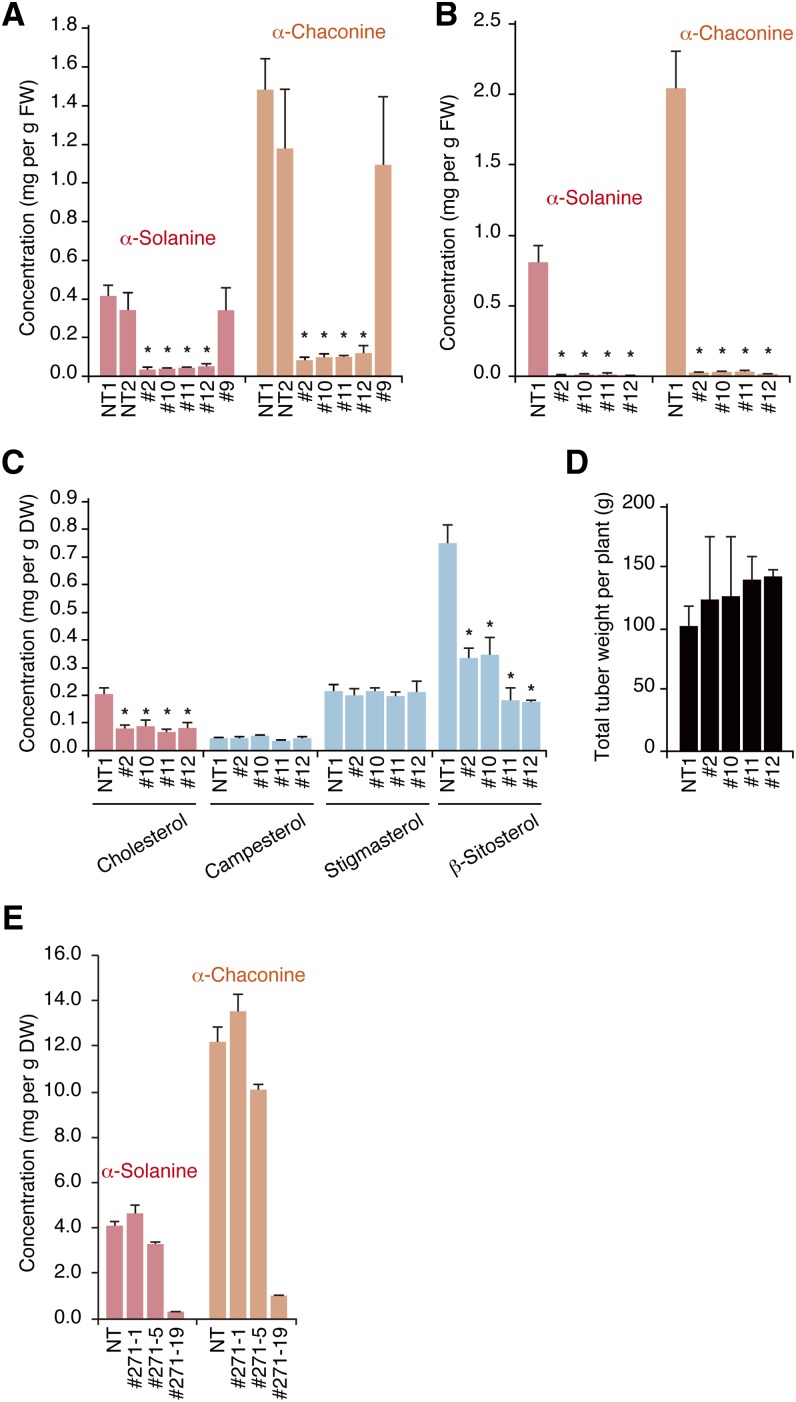
Figure 5.
St SSR2-Silenced and -Disrupted Potato Plants.
(A) The predominant SGA (α-solanine and α-chaconine) levels in the stems of in vitro-grown nontransformed (NT) and St SSR2-silenced (#2, #10, #11, #12, and #9) plants (mean and sd, n = 3). Asterisks indicate values significantly different from the nontransformant (Dunnett's test, P < 0.05). FW, fresh weight.
(B) The predominant SGA levels in the peels of harvested tubers from nontransformed and St SSR2-silenced (#2, #10, #11, and #12) plants (mean and sd, n = 3). Asterisks indicate values significantly different from the nontransformant (Dunnett’s test, P < 0.05). FW, fresh weight.
(C) Cholesterol and C-24 alkylsterol content in the stems of in vitro grown nontransformed and St SSR2-silenced (#2, #10, #11, and #12) plants (mean and sd, n = 3). Asterisks indicate values significantly different from the nontransformant (Dunnett’s test, P < 0.05). DW, dry weight.
(D) Potato tuber yield of nontransformed and St SSR2-silenced (#2, #10, #11, and #12) plants (mean and sd, n = 3).
(E) The predominant SGA levels in the leaves of nontransformed and St SSR2-TALEN transformed (#271-1, #271-5, and #271-19) plants (mean and sd, n = 3). The predominant SGA levels of the nontransformant, #271-1, and #271-5 were significantly different from those of #271-19 (Dunnett’s test, P < 0.05).

