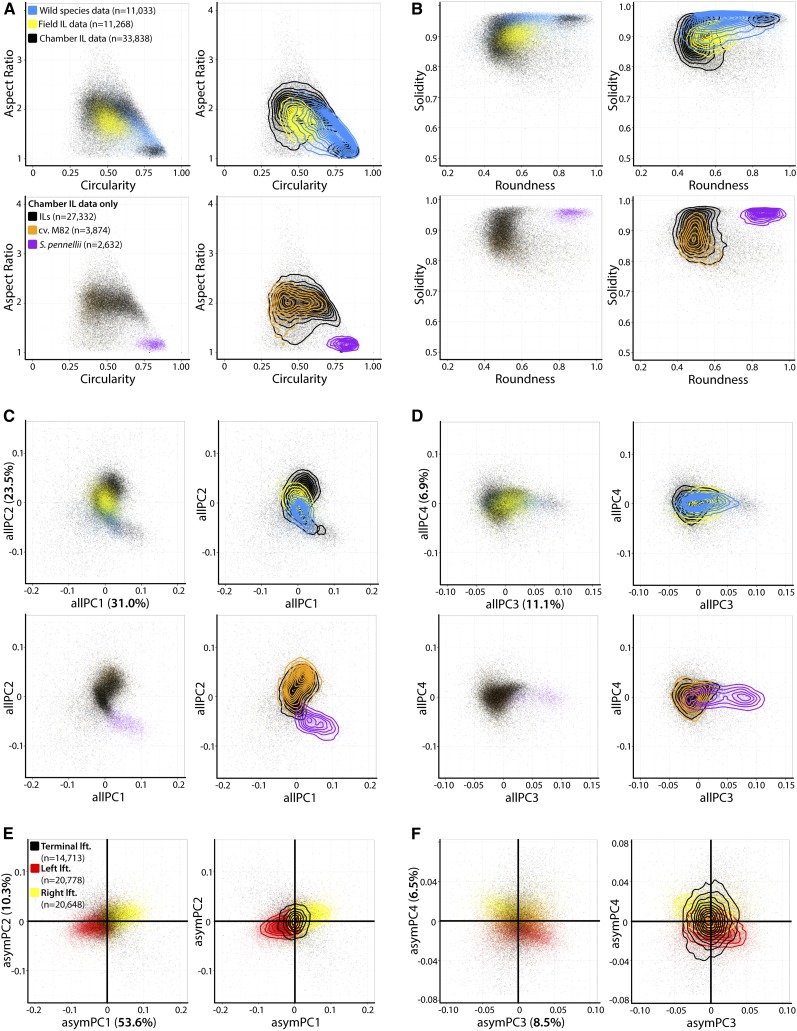
Figure 2.
The Morphospace of Tomato Leaves Measured across Evolutionary Distance, Developmental Context, and Different Environments.
(A) to (D) Distributions of morphometric trait values for leaflets from multiple studies. (A) Aspect ratio and circularity, (B) solidity and roundness, (C) allPC1 and allPC2, and (D) allPC3 and allPC4. In the top panels, wild species data (blue; n = 11,033 leaflets; Chitwood et al., 2012a), IL field-grown leaflets (yellow; n = 11,268 leaflets; Chitwood et al., 2013a), and chamber-grown IL leaflets new to this study (black; n = 33,838) are plotted. Bottom panels represent only new data for chamber-grown IL and parent leaflets in this study (IL leaflets, black; S. lycopersicum cv M82 leaflets, orange; S. pennellii leaflets, purple). Left panels are scatterplots and right panels are contour plots in addition to the scatterplot to help visualize distributions. For all morphometric traits, S. pennellii occupies an extreme position in morphospace and often the shapes of wild species leaves are intermediate between S. lycopersicum and S. pennellii.
(E) and (F) Asymmetric variance is explained by whether a leaflet originates from the left (red) or right (yellow) side of a leaf. Terminal leaflets (black) on average are symmetrical. (E) Scatterplot of asymPC1 and asymPC2 and (F) asymPC3 and asymPC4.

