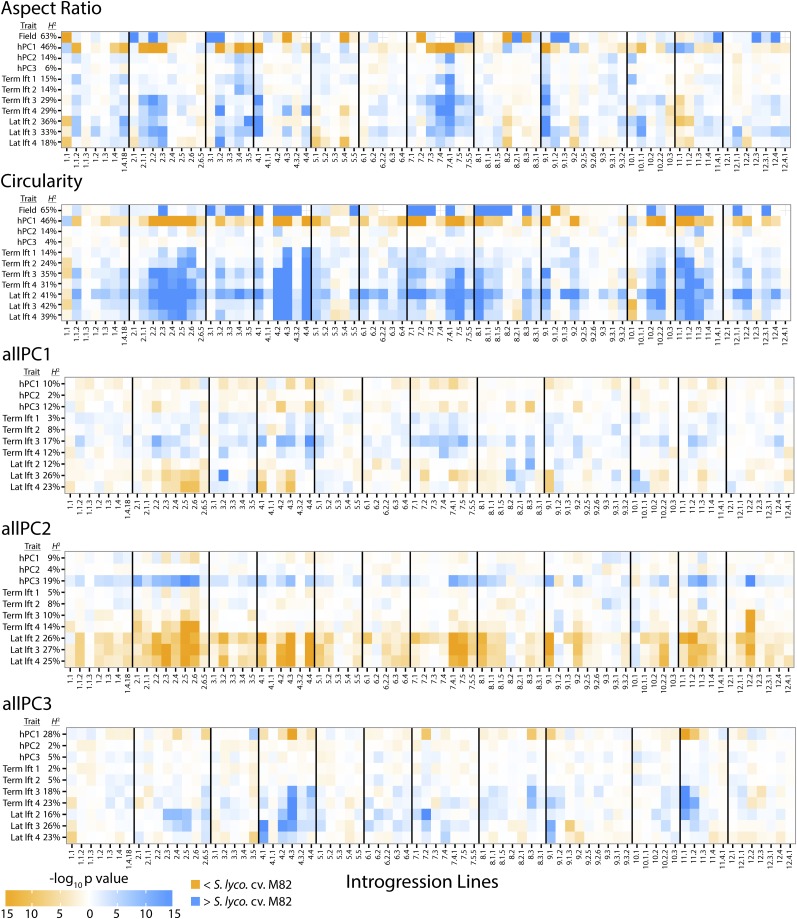
Figure 5.
Overlapping and Distinct QTLs Regulating Leaf Shape.
P values of QTLs regulating leaf shape in the S. pennellii ILs are shown by color. For each shape attribute, QTLs for leaf shape calculated from hPCs 1-3 (see Figure 4) and terminal leaflets from leaves 1-4 (“term. lft.”) and distal lateral leaflets 2-4 (“lat. lft.”) are provided. Because of the genetic structure of the IL population, QTLs are shown on a per IL basis (i.e., QTL in this context refers to the direction and significance of the IL trait value relative to the cv M82 parent). Broad-sense heritability (H2) for each trait is shown. For aspect ratio and circularity, shape QTLs calculated in Chitwood et al. (2013a) under field conditions are shown for comparison. Orange, P values for QTLs decreasing trait values relative to the S. lycopersicum cv M82 parent; blue, P values for QTLs increasing trait values relative to the domesticated parent.

