Figure 6.
DNA Methylation Differences Are Prominent on Long Heterochromatic TEs.
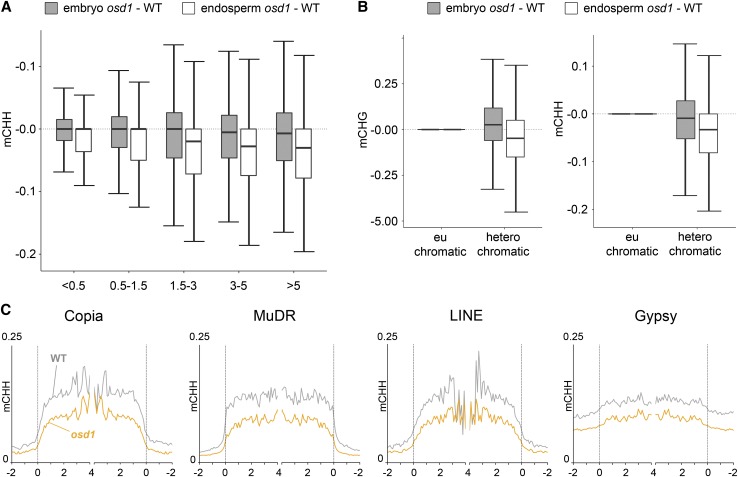
(A) Box plots showing absolute fractional CHH demethylation of 50-bp windows within transposons; numbers on x axis represent length of TEs in kilobases.
(B) Box plots showing absolute fractional CHG (left panel) and CHH (right panel) demethylation of 50-bp windows within euchromatic and heterochromatic TEs. TEs with H3K9m2 log2 scores lower than −1 and higher than 1 are considered euchromatic and heterochromatic, respectively.
(C) CHH methylation levels are plotted as in Figure 4 for TEs belonging to four distinct families.

