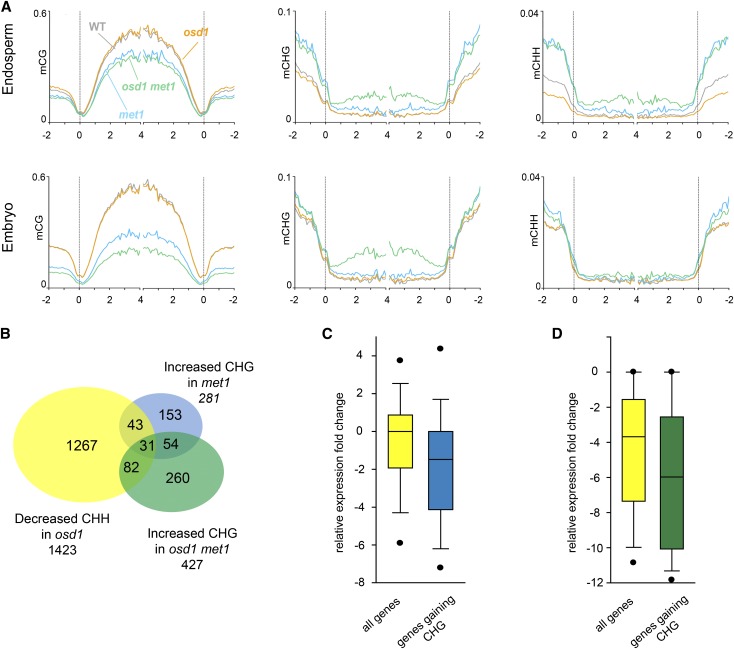
Figure 8.
Loss of CG Methylation Causes Redistribution of CHG and CHH Methylation.
(A) DNA methylation profiles of genes in the endosperm (top panels) and embryo (lower panels) derived from seeds of the following crosses: wild type × wild type, wild type × osd1, wild type × osd1 met1, and wild type × met1. Genes were aligned at the 5′ and 3′ends (dashed lines), and average methylation levels in CG (left panels), CHG (middle panels), and CHH context (right panels) for maternal and paternal alleles for each 100-bp interval were plotted.
(B) Venn diagram showing overlap of genes with decreased CHH methylation in wild type × osd1 crosses compared with the wild type with genes that have increased CHG methylation levels in wild type × met1 and wild type × osd1 met1 compared with wild type and wild type × osd1, respectively.
(C) Box plots of expression changes in diploid seeds upon pollination with met1 pollen compared with wild-type pollinations. The yellow box shows expression changes of all genes with increased expression in triploid seeds, while the blue box shows expression changes of genes that gain CHG methylation upon met1 pollination.
(D) Box plots of expression changes in triploid seeds upon pollination with osd1 met1 pollen compared with osd1 pollinations. The yellow box shows expression changes of all genes with increased expression in triploid seeds, while the green box shows expression changes of genes that gain CHG methylation upon osd1 met1 pollination.

