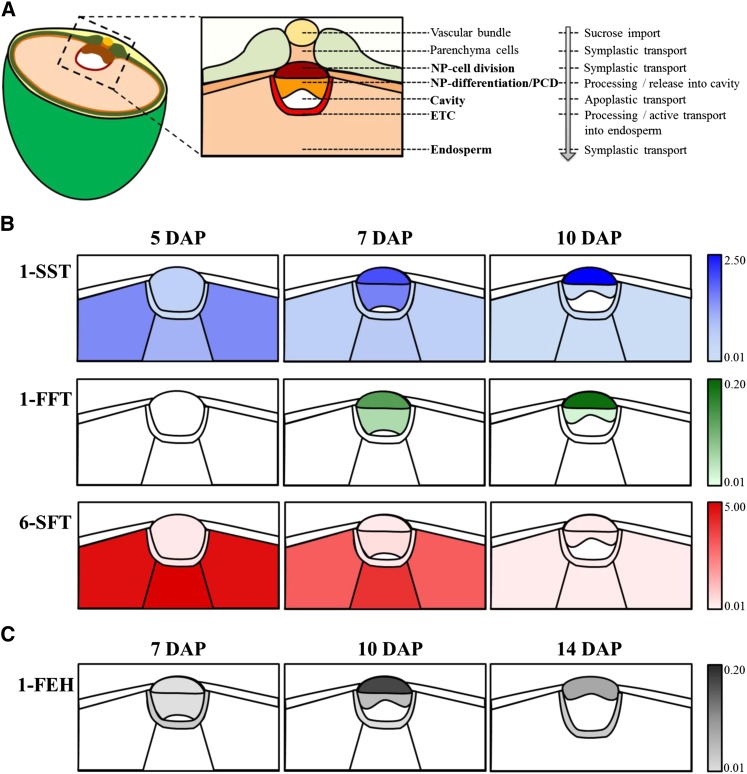
Figure 5.
Graphical Representation of the Transcription Profiles of Genes Involved in Fructan Metabolism in Separated Grain Tissues.
(A) Scheme of a half-sectioned barley grain at storage stage with enlargement of tissues responsible for nutrient transfer into the endosperm. Those shown in bold lettering were analyzed by qRT-PCR using a cDNA collection from laser microdissected grain tissues. After differentiation, the NP displays a heterogeneous tissue with dividing cells in the upper part and elongating cells that partly undergo autolysis. Subsequently, from 7 to 10 DAP, both parts were divided, whereas at 14 DAP, cells of the NP were taken as a whole due to diminishing of the tissue. The endosperm has been divided into the central and the wing parts.
(B) Transcription profiles of the genes encoding biosynthetic enzymes of inulin- (1-SST, blue, and 1-FFT, green) and levan-type (6-SFT, red) fructans.
(C) Transcription profile of the gene encoding 1-FEH.

