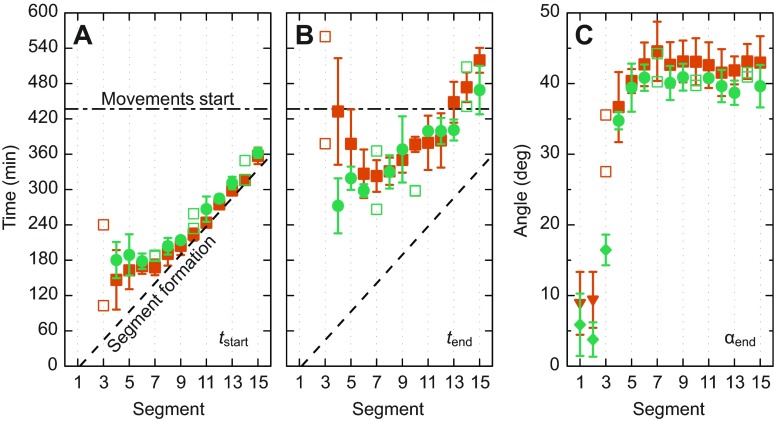
Fig. 3.
Chevron formation for mobile and immobile embryos. (A–C) Filled symbols with error bars depict mean and standard deviation (number of animals N=3–5) for the fit parameters (A) chevron formation start time tstart, (B) end time tend and (C) final chevron angle αend as a function of segment index. In cases where N<3, single measurements are plotted as open symbols. Green circles, mobile embryos; orange squares, immobile embryos. (A,B) The solid black curve indicates somite formation times (Schröter et al., 2008). The horizontal long–short dashed line denotes the average onset of autonomous movements. (C) In addition to the fitting results, the mean angles for non-chevron-forming segments are shown as green diamonds and orange triangles for mobile and immobile embryos, respectively.

