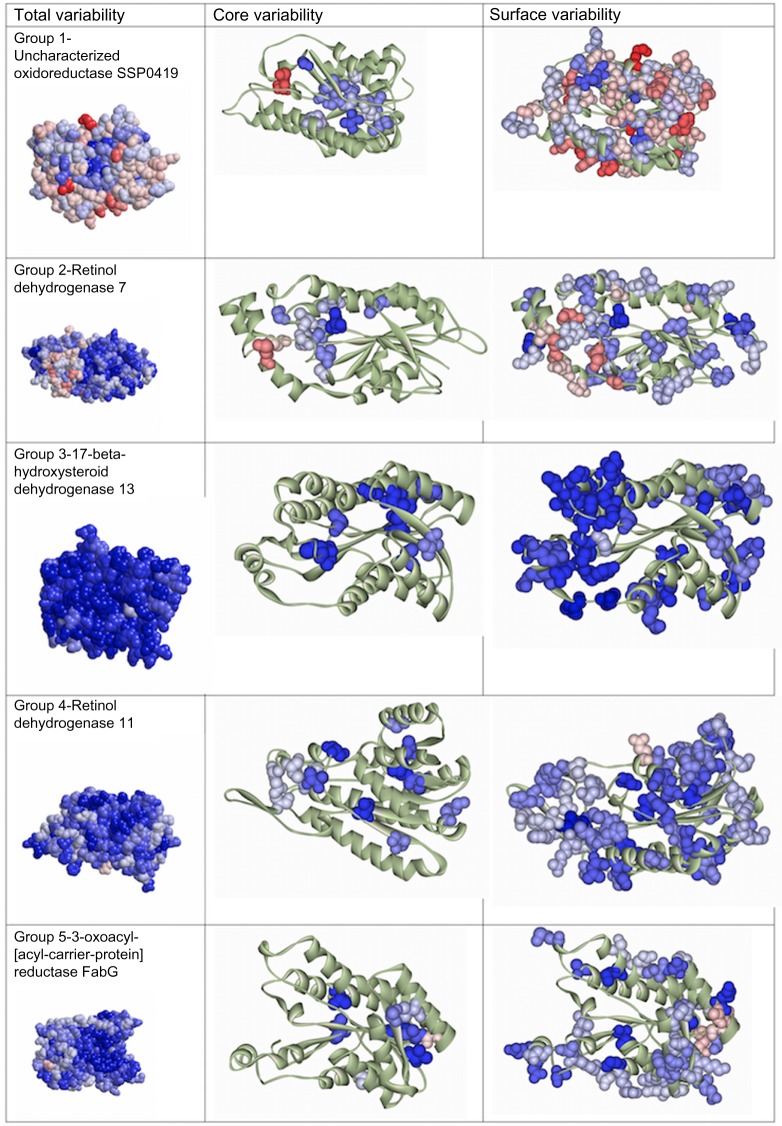
Figure 4.
Variability profiles for each of the five groups of human SDRs. Total, core, and surface variability profiles are displayed for each group based on the distribution of residues on the protein structure. Group 3 displayed the most conservative level (grade 1 of the color scheme is dominant in the entire structure) compared to groups 4 and 5. Group 1 showed the most variable level (full grade of color scheme, from grade 1 to grade 12 in the structure), and group 2 showed an intermediate level of variability.

