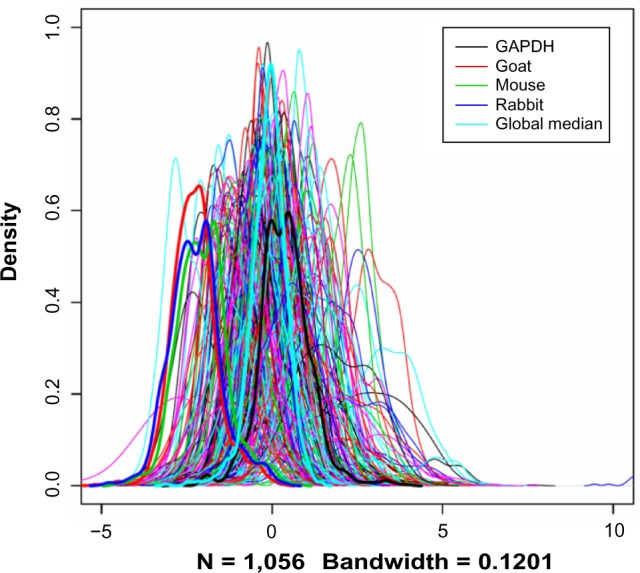
Figure 1.

Distributions of the raw protein concentration values. Each curve corresponds to an RPPA slide (equivalent to a protein).
Notes: The curves for the three NC, the GAPDH slide, and the global median were plotted in thick lines to show their relative positions among the overall data.
