
Figure 5.
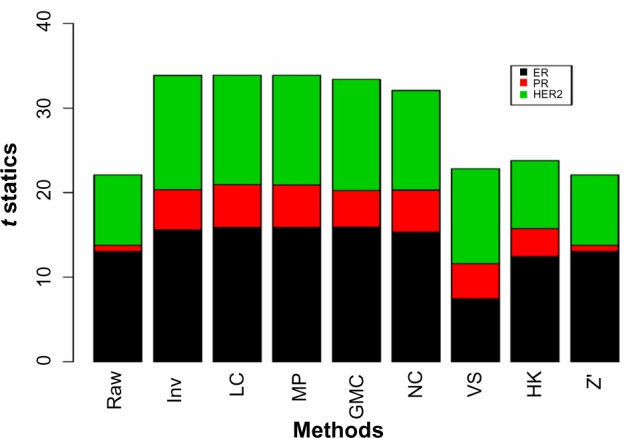
The t-statistics from comparing the mean protein values between the positive and negative groups for ER, PR, and HER2.
Note: The positive and negative calls were determined from IHC/FISH assays.
Official websites use .gov
A
.gov website belongs to an official
government organization in the United States.
Secure .gov websites use HTTPS
A lock (
) or https:// means you've safely
connected to the .gov website. Share sensitive
information only on official, secure websites.
The t-statistics from comparing the mean protein values between the positive and negative groups for ER, PR, and HER2.
Note: The positive and negative calls were determined from IHC/FISH assays.