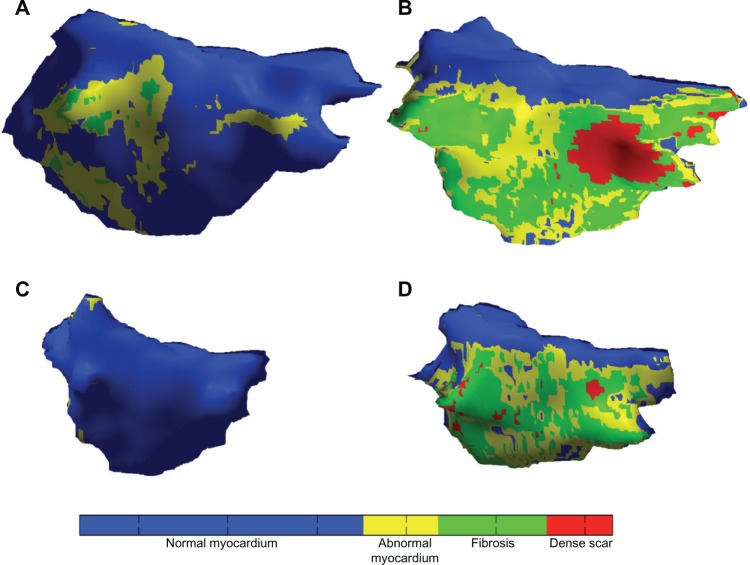
Figure 1.
Fibrosis maps for four patients with variable fibrosis extent and LA size.
Notes: Fibrosis patterns in each of four patients are shown after application of IIR thresholds for LGE-MRI. The colors correspond to IIR thresholds of >0.97, >1.20, and >1.61, corresponding to voltage <0.5, <0.35, and <0.1 mV, respectively.2 Regions with blue color indicate normal myocardium, whereas yellow and green represent a gradation of unhealthy myocardium with increasing fibrosis and red represents dense fibrosis. Patients in the first row (A and B) have dilated atria, whereas those in the bottom row (C and D) have normal atria. Patients in the first column (A and C) have minimal fibrosis depicting the lack of association between atrial volume and fibrosis extent.

