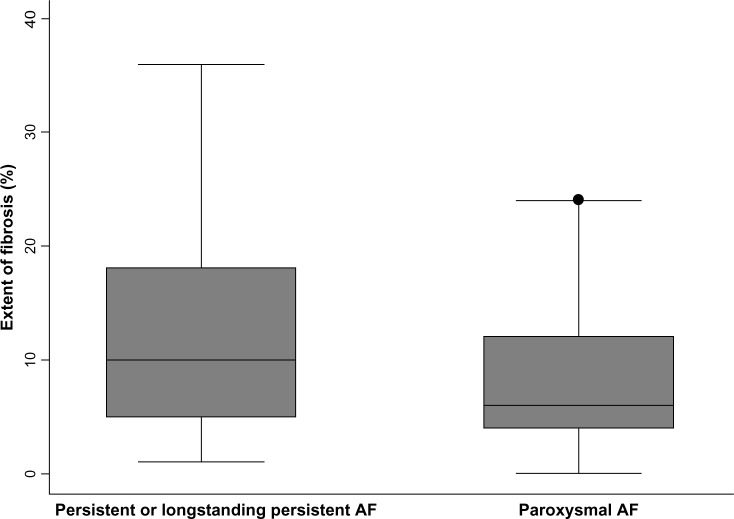
Figure 3.
Distribution of fibrotic extent among patients with paroxysmal versus persistent AF.
Notes: The figure illustrates the extent of fibrosis in patients with persistent and longstanding persistent versus paroxysmal AF. The box plots display the median and the 25th–75th percentile range (center black line and solid gray box), the lower and upper adjacent values (outer black whiskers), and outlier data points (black dot).

