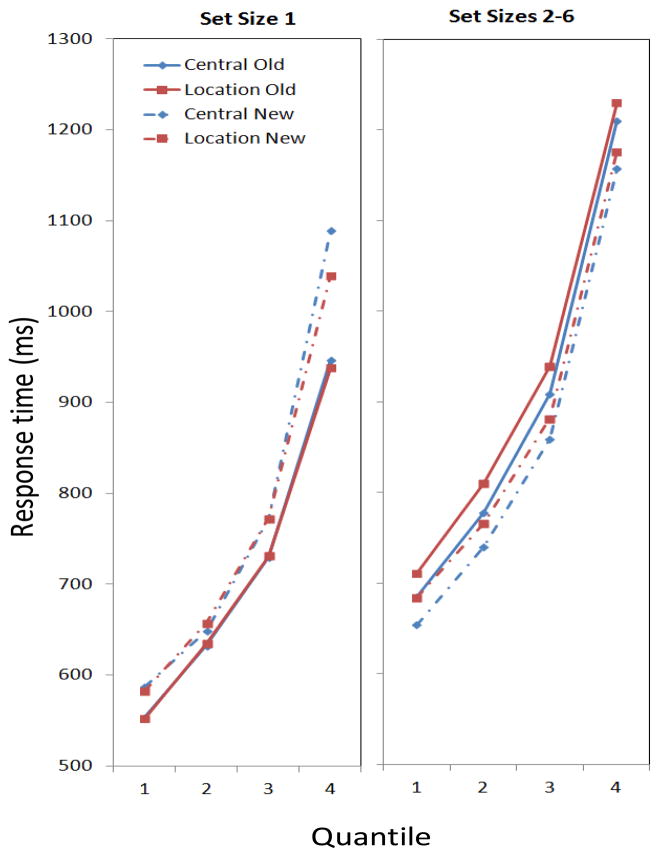
Figure 5.
Means from four groups of data in Experiment 2 reflecting the 0–30th, 31–50th, 51–70th, and 71–90th quantiles in the condition, respectively. Left, Set Size 1; Right, the aggregate of Set Sizes 2–6. The graph parameter is the condition, which depended on the location of the probe (Central vs. Location) and whether the probe was in the array (Old) or not (New).

