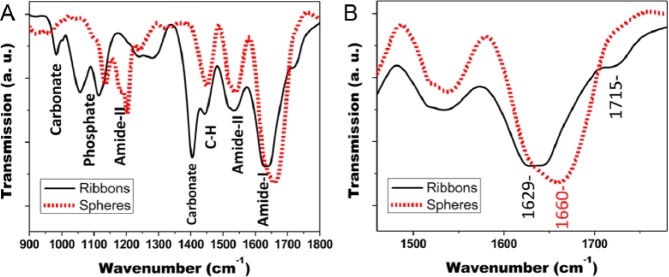
Figure 3.

FTIR analysis of amelogenin nanoribbons and nanospheres. (A) Spectral range from 900 to 1,800 cm−1 shows mineral precipitates as phosphates and carbonates in nanoribbon sample. (B) Sections of amide-I and amide-II show the strong shift of the amide-I peak to lower wavelength in nanoribbons and a high-frequency peak at 1,715 cm−1, indicating increased b-sheet content. Amide-I peak deconvolution is shown in the Appendix.
