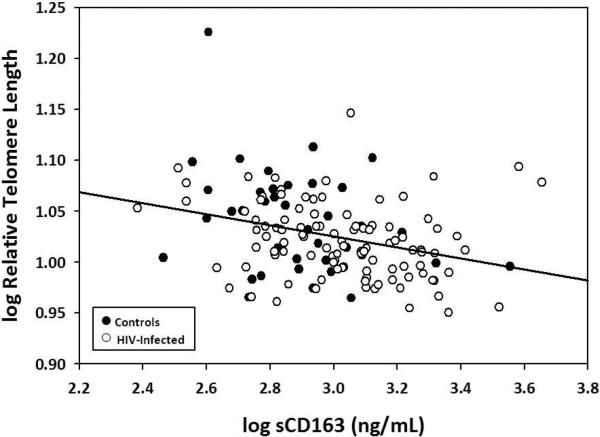
Figure 1. Relationship between sCD163 and telomere length among all subjects.
Data are represented as log for both sCD163 and telomere length for purposes of illustrating linear regression (r=0.31, P=0.0002). Black circles represent control subjects and white circles represent HIV-infected subjects.

