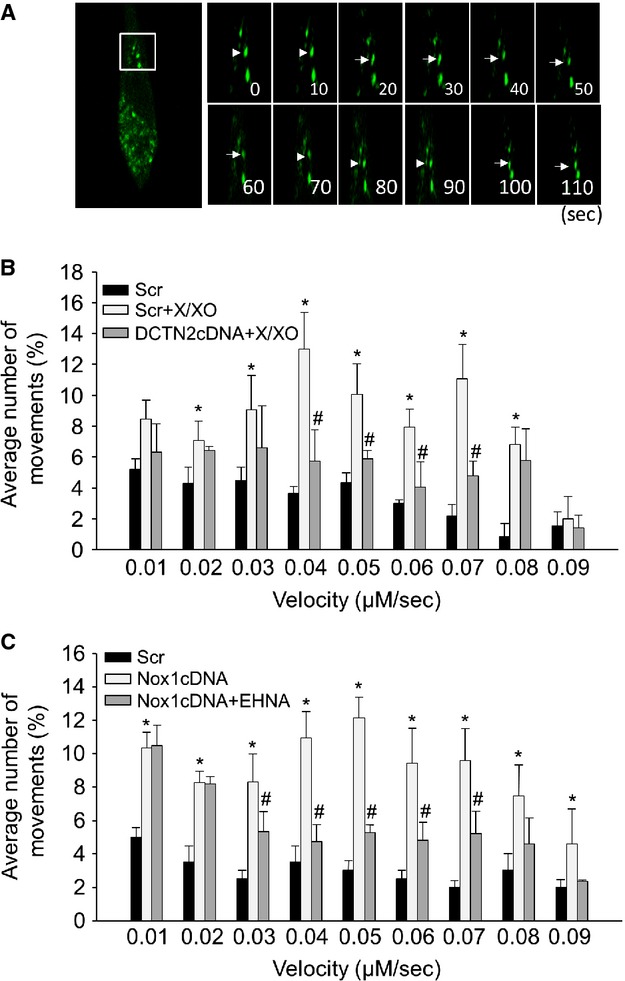
Figure 2.

Analysis of AP dynamic movements. (A) Typical fluorescent images of LC3B-GFP-labelled AP in CAMs were taken every 10 sec. in CAMs. (B and C) The summarized data show the velocity of AP in CAMs pre-treated with EHNA (30 μM) or transfected with dynamitin (DCTN2) cDNA (n = 6 for all panels). *P < 0.05 versus Scramble; #P < 0.05 versus CAMs with X/XO or Nox1 cDNA transfection alone.
